
CHINESE JOURNAL OF PARASITOLOGY AND PARASITIC DISEASES ›› 2024, Vol. 42 ›› Issue (3): 286-294.doi: 10.12140/j.issn.1000-7423.2024.03.002
• ORIGINAL ARTICLES • Previous Articles Next Articles
JIANG Nan1( ), SU Yaxin1, JIANG Xiaofeng1, SHEN Yujuan1,2, CAO Jianping1,2,*()
Received:2024-05-18
Revised:2024-05-22
Online:2024-06-30
Published:2024-07-16
Supported by:CLC Number:
JIANG Nan, SU Yaxin, JIANG Xiaofeng, SHEN Yujuan, CAO Jianping. Heterogeneity analysis of T cells in liver of mice infected with Echinococcus granulosus based on single-cell RNA sequencing[J]. CHINESE JOURNAL OF PARASITOLOGY AND PARASITIC DISEASES, 2024, 42(3): 286-294.
Add to citation manager EndNote|Ris|BibTeX
URL: https://www.jsczz.cn/EN/10.12140/j.issn.1000-7423.2024.03.002
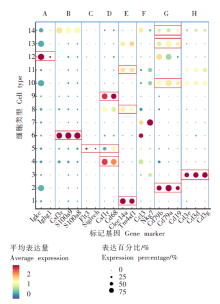
Fig. 1
Bubble map of gene markers for cell types of liver tissues in mice infected with E. granulosus A: Plasma cell; B: Neutrophil; C: Dendritic cell; D: Macrophage; E: Endothelial cell; F: Natural killer cell; G: B cell: H: T cell.
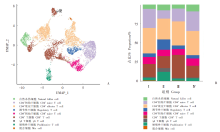
Fig. 2
Re-clustering analysis and annotation of T cells types of liver tissues in mice infected with E. granulosus A: UMAP scatter of T cell subtypes; B: The percent stacked column chart of T cell subtypes at different times after infection. Ⅰ: One month after infection; Ⅱ: Three months after infection; Ⅲ: Six months after infection; Ⅳ: Control group.
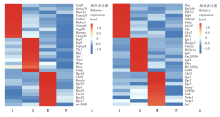
Fig. 3
Differentially expressed genes in Tregs (A) and CD8+ T cell (B) of of liver tissues in mice infected with E. granulosus Ⅰ: One month after infection; Ⅱ: Three months after infection; Ⅲ: Six months after infection; Ⅳ: Control group.
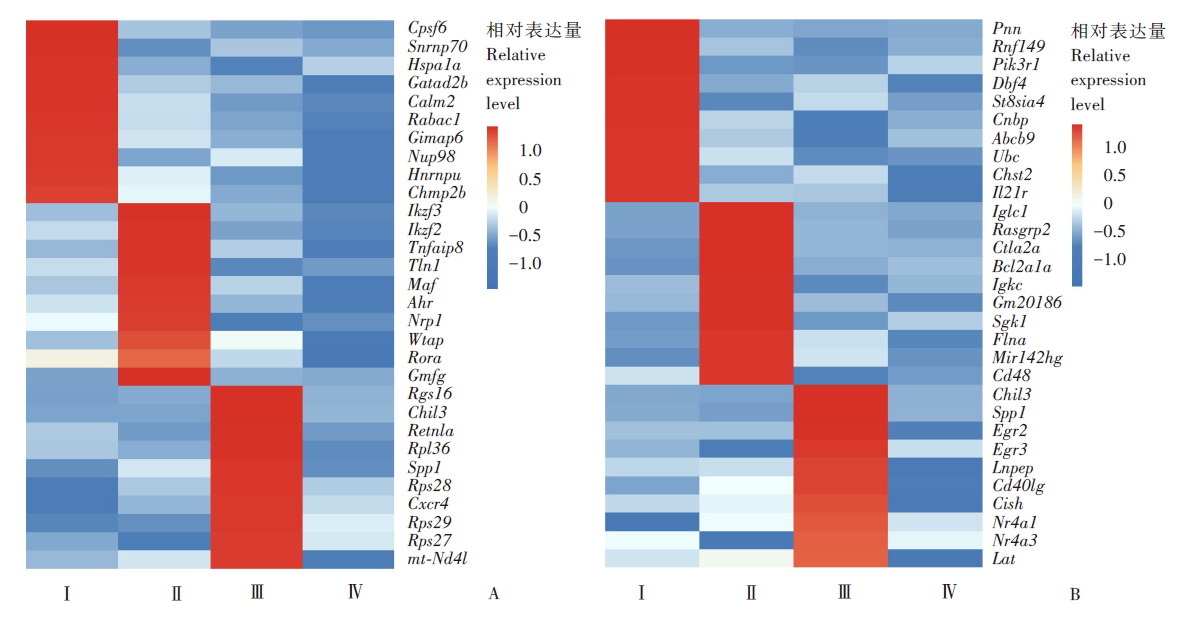
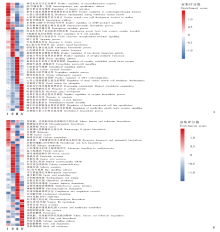
Fig. 4
GO (A) and KEGG (B) analysis of differentially expressed genes of Tregs in liver tissues in mice infected with E. granulosus Ⅰ-Ⅲ: One, three and six months after infection, respectively; Ⅳ: Control group.
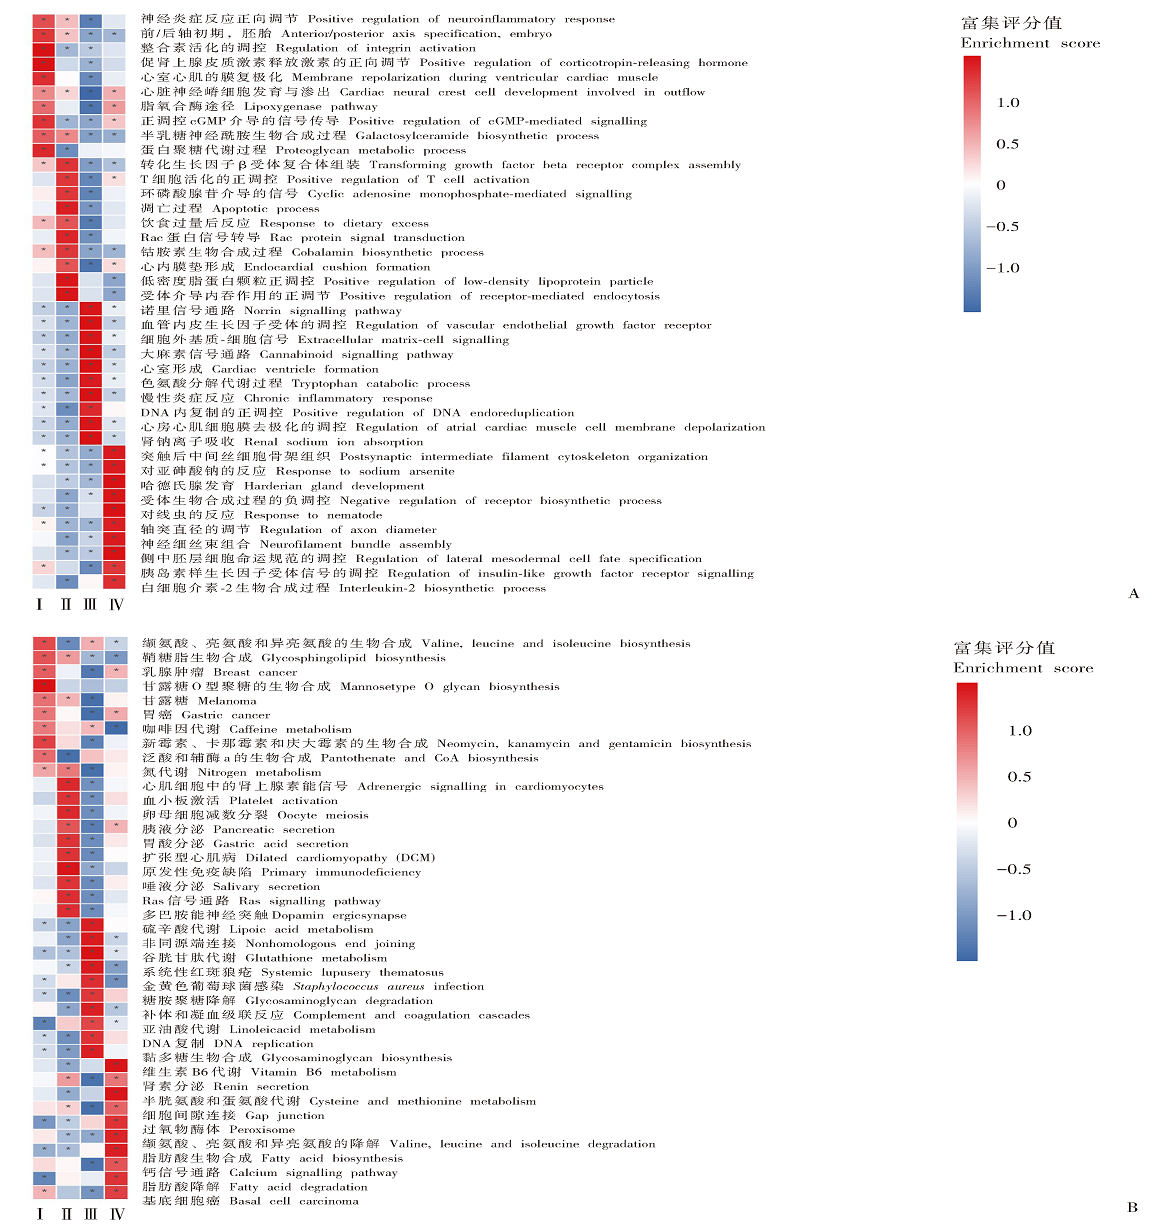
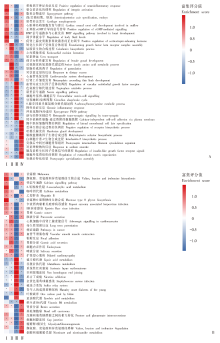
Fig. 5
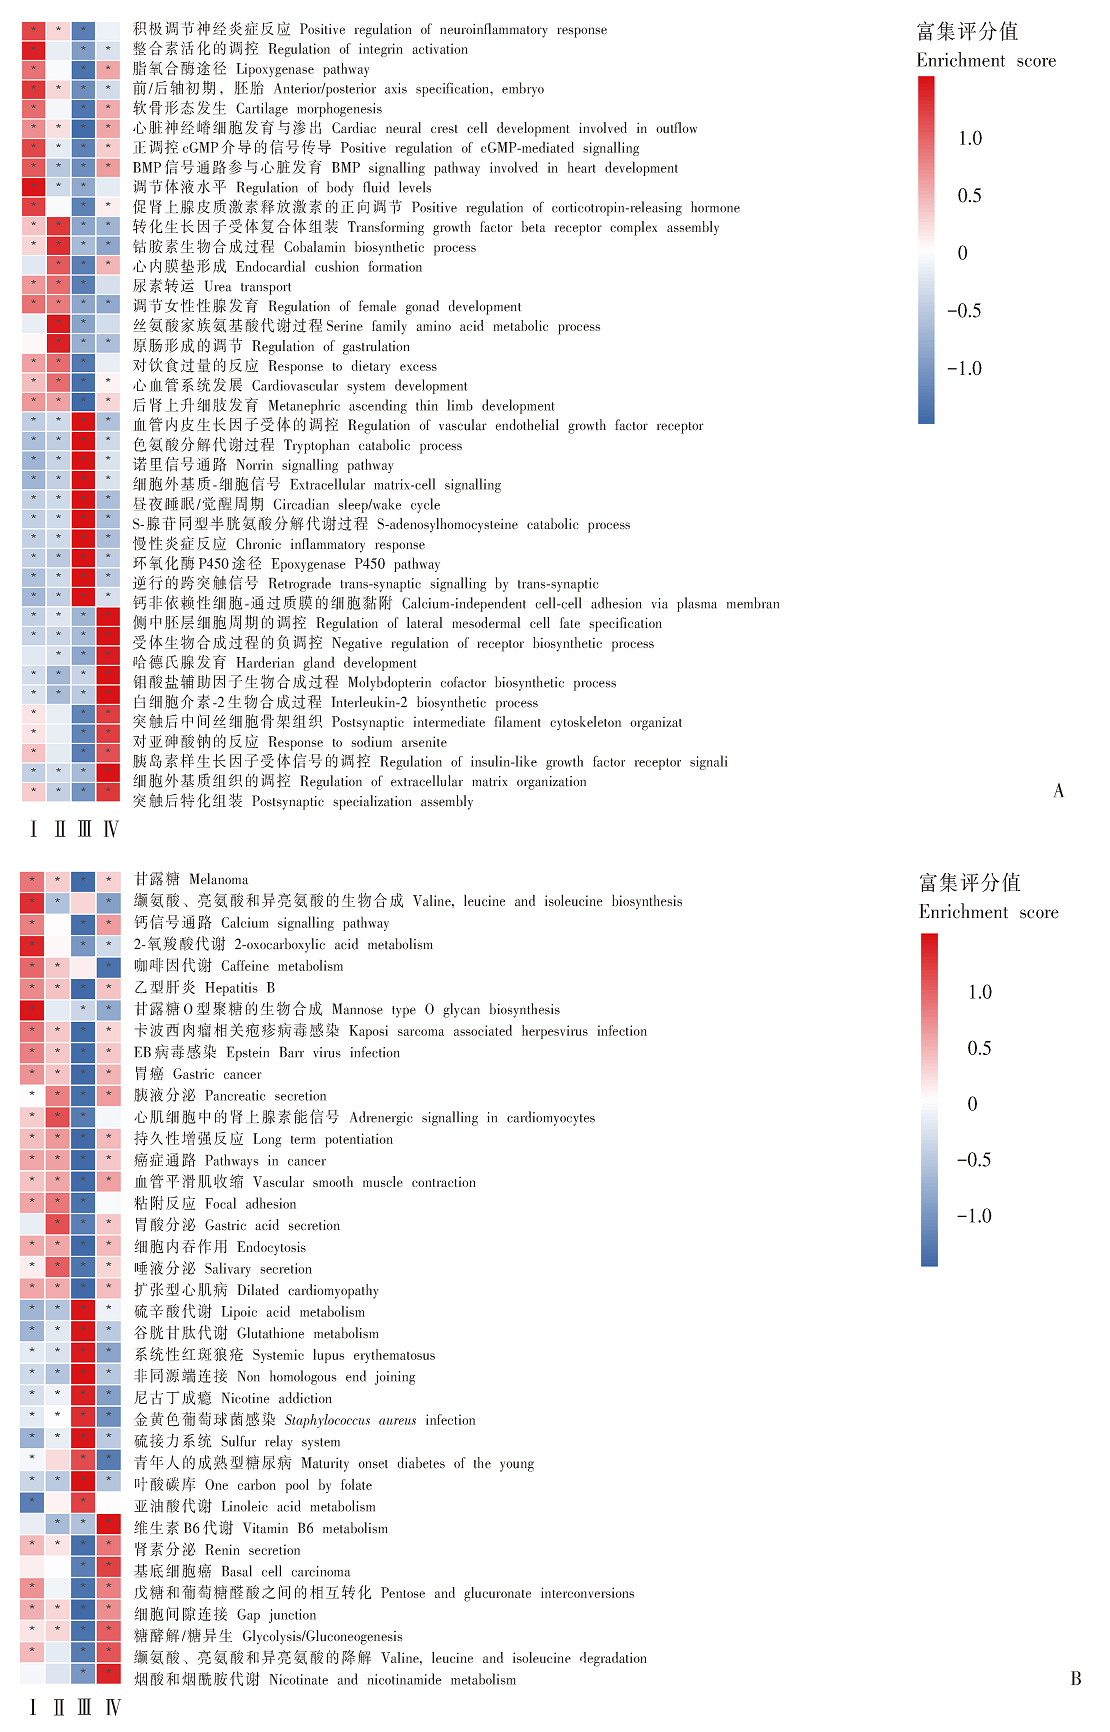
GO (A) and KEGG (B) analysis of differentially expressed genes in CD8+ T cells of liver tissues in mice infected with E. granulosus Ⅰ-Ⅲ: One, three and six months after infection, respectively; Ⅳ: Control group.
| [1] | McManus DP, Gray DJ, Zhang WB, et al. Diagnosis, treatment, and management of echinococcosis[J]. BMJ, 2012, 344: e3866. |
| [2] | Kui Y, Xue CZ, Wang X, et al. Progress of echinococcosis control in China, 2022[J]. Chin J Parasitol Parasit Dis, 2024, 42(1): 8-16. (in Chinese) |
|
(蒉嫣, 薛垂召, 王旭, 等. 2022年全国棘球蚴病防治工作进展[J]. 中国寄生虫学与寄生虫病杂志, 2024, 42(1): 8-16.)
doi: 10.12140/j.issn.1000-7423.2024.01.002 |
|
| [3] | Gottstein B, Soboslay P, Ortona E, et al. Chapter one immunology of alveolar and cystic echinococcosis (AE and CE)[J]. Adv Parasitol, 2017, 96: 1-54. |
| [4] | Ammann RW, Eckert J. Cestodes. Echinococcus[J]. Gastroenterol Clin North Am, 1996, 25(3): 655-689. |
| [5] | Govindasamy A, Bhattarai PR, John J. Liver cystic echinococcosis: a parasitic review[J]. Ther Adv Infect Dis, 2023, 10: 20499361231171478. |
| [6] |
Zhao JJ, Zhang SY, Liu Y, et al. Single-cell RNA sequencing reveals the heterogeneity of liver-resident immune cells in human[J]. Cell Discov, 2020, 6: 22.
doi: 10.1038/s41421-020-0157-z pmid: 32351704 |
| [7] | Massalha H, Bahar Halpern K, Abu-Gazala S, et al. A single cell atlas of the human liver tumor microenvironment[J]. Mol Syst Biol, 2020, 16(12): e9682. |
| [8] |
Hedlund E, Deng QL. Single-cell RNA sequencing: technical advancements and biological applications[J]. Mol Aspects Med, 2018, 59: 36-46.
doi: S0098-2997(17)30053-5 pmid: 28754496 |
| [9] | Chu MJ, Song YF, Lu HH, et al. Advances in the application of single cell sequencing technology in the study of zoonotic parasitic diseases[J]. Chin Vet Sci, 2023, 53(2): 231-238. (in Chinese) |
| (褚梦洁, 宋雅菲, 卢惠红, 等. 单细胞测序技术在人兽共患寄生虫病研究中的应用进展[J]. 中国兽医科学, 2023, 53(2): 231-238.) | |
| [10] | Wendt G, Zhao L, Chen R, et al. A single-cell RNA-seq atlas of Schistosoma mansoni identifies a key regulator of blood feeding[J]. Science, 2020, 369(6511): 1644-1649. |
| [11] | Waldman BS, Schwarz D, Wadsworth MH 2nd, et al. Identification of a master regulator of differentiation in Toxoplasma[J]. Cell, 2020, 180(2): 359-372.e16. |
| [12] | Rawat M, Srivastava A, Johri S, et al. Single-cell RNA sequencing reveals cellular heterogeneity and stage transition under temperature stress in synchronized Plasmodium falciparum cells[J]. Microbiol Spectr, 2021, 9(1): e0000821. |
| [13] | Yang QQ, Jia WZ, Wang XQ, et al. Single-cell RNA sequencing deciphers transcriptional profiles of hepatocytes in mouse with hepatic alveolar echinococcosis[J]. Chin J Schisto Control, 2023, 35(3): 236-243. (in Chinese) |
| (杨清清, 贾万忠, 王向前, 等. 基于单细胞转录组测序解析小鼠肝泡型棘球蚴病肝脏细胞转录谱特征[J]. 中国血吸虫病防治杂志, 2023, 35(3): 236-243.) | |
| [14] | Jiang XF, Zhang XF, Jiang N, et al. The single-cell landscape of cystic echinococcosis in different stages provided insights into endothelial and immune cell heterogeneity[J]. Front Immunol, 2022, 13: 1067338. |
| [15] |
Ayers J, Milner RJ, Cortés-Hinojosa G, et al. Novel application of single-cell next-generation sequencing for determination of intratumoral heterogeneity of canine osteosarcoma cell lines[J]. J Vet Diagn Invest, 2021, 33(2): 261-278.
doi: 10.1177/1040638720985242 pmid: 33446089 |
| [16] |
Dobin A, Davis CA, Schlesinger F, et al. STAR: ultrafast universal RNA-seq aligner[J]. Bioinformatics, 2013, 29(1): 15-21.
doi: 10.1093/bioinformatics/bts635 pmid: 23104886 |
| [17] |
McGinnis CS, Murrow LM, Gartner ZJ. DoubletFinder: doublet detection in single-cell RNA sequencing data using artificial nearest neighbors[J]. Cell Syst, 2019, 8(4): 329-337.e4.
doi: S2405-4712(19)30073-0 pmid: 30954475 |
| [18] |
Aran D, Looney AP, Liu LQ, et al. Reference-based analysis of lung single-cell sequencing reveals a transitional profibrotic macrophage[J]. Nat Immunol, 2019, 20(2): 163-172.
doi: 10.1038/s41590-018-0276-y pmid: 30643263 |
| [19] |
Heng TS, Painter MW, Immunological Genome Project Consortium. The Immunological Genome Project: networks of gene expression in immune cells[J]. Nat Immunol, 2008, 9(10): 1091-1094.
doi: 10.1038/ni1008-1091 pmid: 18800157 |
| [20] | Pan W, Zhou HJ, Shen YJ, et al. Surveillance on the status of immune cells after Echinnococcus granulosus protoscoleces infection in Balb/c mice[J]. PLoS One, 2013, 8(3): e59746. |
| [21] | Zhang XF, Gong WC, Cao SK, et al. Dynamic changes of myeloid-derived suppressor cells and regulatory T cells in livers of mice infected with Echinococcus granulosus[J]. Chin J Schisto Control, 2019, 31(6): 622-627. (in Chinese) |
| (张小凡, 巩文词, 曹胜魁, 等. 细粒棘球绦虫感染小鼠肝脏髓源抑制性细胞与调节性T细胞比例动态变化[J]. 中国血吸虫病防治杂志, 2019, 31(6): 622-627.) | |
| [22] |
Zhang Q, Zhu YR, Lv CJ, et al. AhR activation promotes Treg cell generation by enhancing Lkb1-mediated fatty acid oxidation via the Skp2/K63-ubiquitination pathway[J]. Immunology, 2023, 169(4): 412-430.
doi: 10.1111/imm.13638 pmid: 36930164 |
| [23] |
Klann JE, Remedios KA, Kim SH, et al. Talin plays a critical role in the maintenance of the regulatory T cell pool[J]. J Immunol, 2017, 198(12): 4639-4651.
doi: 10.4049/jimmunol.1601165 pmid: 28515282 |
| [24] | Han YH, Kim HJ, Na H, et al. RORα induces KLF4-mediated M2 polarization in the liver macrophages that protect against nonalcoholic steatohepatitis[J]. Cell Rep, 2017, 20(1): 124-135. |
| [25] | Haim-Vilmovsky L, Henriksson J, Walker JA, et al. Mapping Rora expression in resting and activated CD4+ T cells[J]. PLoS One, 2021, 16(5): e0251233. |
| [26] |
Overacre-Delgoffe AE, Chikina M, Dadey RE, et al. Interferon-γ drives treg fragility to promote anti-tumor immunity[J]. Cell, 2017, 169(6): 1130-1141.e11.
doi: S0092-8674(17)30532-9 pmid: 28552348 |
| [27] |
Andrabi SBA, Batkulwar K, Bhosale SD, et al. HIC1 interacts with FOXP3 multi protein complex: novel pleiotropic mechanisms to regulate human regulatory T cell differentiation and function[J]. Immunol Lett, 2023, 263: 123-132.
doi: 10.1016/j.imlet.2023.09.001 pmid: 37838026 |
| [28] |
Bonazzi S, d’Hennezel E, Beckwith REJ, et al. Discovery and characterization of a selective IKZF2 glue degrader for cancer immunotherapy[J]. Cell Chem Biol, 2023, 30(3): 235-247.e12.
doi: 10.1016/j.chembiol.2023.02.005 pmid: 36863346 |
| [29] | Lou YW, Liu SX. The TIPE (TNFAIP8) family in inflammation, immunity, and cancer[J]. Mol Immunol, 2011, 49(1/2): 4-7. |
| [30] | Xu M, Pokrovskii M, Ding Y, et al. C-MAF-dependent regulatory T cells mediate immunological tolerance to a gut pathobiont[J]. Nature, 2018, 554(7692): 373-377. |
| [31] | Wu H, Zhao XF, Hochrein SM, et al. Mitochondrial dysfunction promotes the transition of precursor to terminally exhausted T cells through HIF-1α-mediated glycolytic reprogramming[J]. Nat Commun, 2023, 14(1): 6858. |
| [32] |
Klement JD, Paschall AV, Redd PS, et al. An osteopontin/CD44 immune checkpoint controls CD8+ T cell activation and tumor immune evasion[J]. J Clin Invest, 2018, 128(12): 5549-5560.
doi: 10.1172/JCI123360 pmid: 30395540 |
| [33] |
Soysouvanh F, Rousseau D, Bonnafous S, et al. Osteopontin-driven T-cell accumulation and function in adipose tissue and liver promoted insulin resistance and MAFLD[J]. Obesity, 2023, 31(10): 2568-2582.
doi: 10.1002/oby.23868 pmid: 37724058 |
| [34] | Wang KY, Hou HY, Zhang YN, et al. Ovarian cancer-associated immune exhaustion involves SPP1+ T cell and NKT cell, symbolizing more malignant progression[J]. Front Endocrinol, 2023, 14: 1168245. |
| [35] | Sharma P, Sharma A, Vishwakarma AL, et al. Host lung immunity is severely compromised during tropical pulmonary eosinophilia: role of lung eosinophils and macrophages[J]. J Leukoc Biol, 2016, 99(4): 619-628. |
| [36] | Jung IY, Narayan V, McDonald S, et al. BLIMP1 and NR4A3 transcription factors reciprocally regulate antitumor CAR T cell stemness and exhaustion[J]. Sci Transl Med, 2022, 14(670): eabn7336. |
| [37] | Symonds ALJ, Miao TZ, Busharat Z, et al. Egr2 and 3 maintain anti-tumour responses of exhausted tumour infiltrating CD8+ T cells[J]. Cancer Immunol Immunother, 2023, 72(5): 1139-1151. |
| [38] | Bai YM, Hu ML, Chen ZX, et al. Single-cell transcriptome analysis reveals RGS1 as a new marker and promoting factor for T-cell exhaustion in multiple cancers[J]. Front Immunol, 2021, 12: 767070. |
| [39] | Zhuang J, Qu ZB, Chu J, et al. Single-cell transcriptome analysis reveals T population heterogeneity and functions in tumor microenvironment of colorectal cancer metastases[J]. Heliyon, 2023, 9(7): e17119. |
| [40] |
Srivastava R, Dervillez X, Khan AA, et al. The herpes simplex virus latency-associated transcript gene is associated with a broader repertoire of virus-specific exhausted CD8+ T cells retained within the trigeminal ganglia of latently infected HLA transgenic rabbits[J]. J Virol, 2016, 90(8): 3913-3928.
doi: 10.1128/JVI.02450-15 pmid: 26842468 |
| [41] | Srirat T, Hayakawa T, Mise-Omata S, et al. NR4a1/2 deletion promotes accumulation of TCF1+ stem-like precursors of exhausted CD8+ T cells in the tumor microenvironment[J]. Cell Rep, 2024, 43(3): 113898. |
| [1] | WU Yixuan, GUO Xiaola, CHEN Yixia. MicroRNA differential expression profiles and their diagnostic value in the sheep infected with Echinococcus granulosus [J]. CHINESE JOURNAL OF PARASITOLOGY AND PARASITIC DISEASES, 2024, 42(3): 295-302. |
| [2] | HOU Mengdan, JIGU Xiaoan, LIU Weiwei, QIU Meiling, HU Meihe, LI Kunlei, JIAYINAER Jikesanbayi, ZHAI Shaohua. Pathological changes in the formation of Echinococcus granulosus cysts in sheep liver at different stages [J]. CHINESE JOURNAL OF PARASITOLOGY AND PARASITIC DISEASES, 2024, 42(3): 316-324. |
| [3] | TONG Guodong, ZHU Qinghao, WANG Jun, LIU Xiaoran, SHEN Yan, LIANG Jiao, LI Yinghui, HUANG Yuxiao, WANG Yi, ZHAO Ya. Activation of astrocytes and neuronal damage induced by the inflammatory microenvironment of cerebral malaria [J]. CHINESE JOURNAL OF PARASITOLOGY AND PARASITIC DISEASES, 2024, 42(2): 160-168. |
| [4] | LI Kunlei, XIA Jun, QIU Meiling, HU Meihe, JIGU Xiaoan, HOU Mengdan, ZHAI Shaohua. Effect of active ingredients of antiparasitic Chinese herb medicine on Echinococcus granulosus in vitro [J]. CHINESE JOURNAL OF PARASITOLOGY AND PARASITIC DISEASES, 2024, 42(2): 191-198. |
| [5] | WANG Chunsheng, WU Ergeli, XILIZATI Kulaixi, LI Yuqian, XIANYIDAN Abula, SUBI Tailaiti, PU Xueli, WANG Jialing, LI Meng, FANG Zhiyuan, YE Jianrong. Therapeutic effects of IL-1β receptor blocker on lung injury during the sensitization process of Echinococcus granulosus cyst fluid [J]. CHINESE JOURNAL OF PARASITOLOGY AND PARASITIC DISEASES, 2024, 42(2): 199-203. |
| [6] | LI Tao, LI Zihua, ZHANG Cuiying, ZHAO Wei. Identification and analysis of host proteins in the cyst wall and cyst fluid of Echinococcus granulosus in human infection [J]. CHINESE JOURNAL OF PARASITOLOGY AND PARASITIC DISEASES, 2023, 41(6): 677-682. |
| [7] | ZHAO Lei, LI Jia, MO Gang, LI Chun, HUANG Guoyang, PENG Xiaohong. Effect of Clonorchis sinensis infection on hepatic fibrosis and immune regulation in mice [J]. CHINESE JOURNAL OF PARASITOLOGY AND PARASITIC DISEASES, 2023, 41(6): 760-765. |
| [8] | LU Junxia, XU Junying, ZHAO Bin, WANG Qianwen, LI Wenhua, GENG Yuqing, HOU Jun, WU Xiangwei, CHEN Xueling. Echinococcus granulosus infection induces macrophages to express CD73 and A2AR to suppress inflammatory response [J]. CHINESE JOURNAL OF PARASITOLOGY AND PARASITIC DISEASES, 2023, 41(5): 559-566. |
| [9] | WU Xiaoying, HU Yuan, CAO Jianping. Preparation of Echinococcus granulosus peptide embedded in chitosan quaternary ammonium salt nanoparticles [J]. CHINESE JOURNAL OF PARASITOLOGY AND PARASITIC DISEASES, 2023, 41(3): 300-305. |
| [10] | LI Benfu, WANG Zhengqing, XU Qian, ZI Jinrong, YAN Xinliu, PENG Jia, LI Jianxiong, CAI Xuan, WU Fangwei, YANG Yaming. Sequence analysis of mitochondrial co1 and nd1 genes in Echinococcus granulosus in Yunnan Province [J]. CHINESE JOURNAL OF PARASITOLOGY AND PARASITIC DISEASES, 2023, 41(3): 306-311. |
| [11] | GUO Gang, REN Yuan, JIAO Hongjie, WU Juan, GUO Baoping, QI Wenjing, LI Jun, ZHANG Wenbao. Effect of intraperitoneal inoculation with Echinococcus microcysts on the infection and pathogenicity of E. multilocularis in mouse liver [J]. CHINESE JOURNAL OF PARASITOLOGY AND PARASITIC DISEASES, 2023, 41(2): 156-162. |
| [12] | JIAO Hongjie, QI Wenjing, GUO Gang, BAO Jianling, WU Chuanchuan, SONG Chuanlong, LI Jun, ZHANG Wenbao, YAN Mei. Polarization effect of Echinococcus granulosus antigen B on the mouse macrophage RAW264.7 [J]. CHINESE JOURNAL OF PARASITOLOGY AND PARASITIC DISEASES, 2023, 41(1): 23-28. |
| [13] | HOU Xin-ling, LI De-wei, SHI Yang, WANG Mao-lin, ZIBIGU Rousu, ABIDAN Ainiwaer, ZHENG Xu-ran, KANG Xue-jiao, WANG Hui, LI Jing, ZHANG Chuan-shan. Changes of ST2+ T cell subset function and their immune checkpoint molecule expression in the peritoneal cavity of mice infected with Echinococcus multilocularis [J]. CHINESE JOURNAL OF PARASITOLOGY AND PARASITIC DISEASES, 2022, 40(6): 708-716. |
| [14] | WU De-fang, FU Yong, REN Bin, ZHANG Yao-gang, XU Xiao-lei, PANG Ming-quan, FAN Hai-ning. Genetic diversity and differentiation time of human isolates of Echinococcus granulosus and E. multilocularis from Qinghai [J]. CHINESE JOURNAL OF PARASITOLOGY AND PARASITIC DISEASES, 2022, 40(5): 610-615. |
| [15] | QIAO Shi-yuan, ZHOU Xue, LIU Cheng-hao, JIANG Hui-jiao, BU Yuan-yuan, CHEN Xue-ling, WU Xiang-wei. Effect of albendazole-loaded vesicles on the vitality of protoscoleces of Echinococcus granulosus [J]. CHINESE JOURNAL OF PARASITOLOGY AND PARASITIC DISEASES, 2022, 40(3): 324-329. |
| Viewed | ||||||
|
Full text |
|
|||||
|
Abstract |
|
|||||