
CHINESE JOURNAL OF PARASITOLOGY AND PARASITIC DISEASES ›› 2023, Vol. 41 ›› Issue (1): 23-28.doi: 10.12140/j.issn.1000-7423.2023.01.004
• ORIGINAL ARTICLES • Previous Articles Next Articles
JIAO Hongjie1( ), QI Wenjing2, GUO Gang1, BAO Jianling1, WU Chuanchuan2, SONG Chuanlong1, LI Jun1, ZHANG Wenbao1,2, YAN Mei1,*()
Received:2022-06-13
Revised:2022-07-10
Online:2023-02-28
Published:2023-02-24
Contact:
* E-mail: Supported by:CLC Number:
JIAO Hongjie, QI Wenjing, GUO Gang, BAO Jianling, WU Chuanchuan, SONG Chuanlong, LI Jun, ZHANG Wenbao, YAN Mei. Polarization effect of Echinococcus granulosus antigen B on the mouse macrophage RAW264.7[J]. CHINESE JOURNAL OF PARASITOLOGY AND PARASITIC DISEASES, 2023, 41(1): 23-28.
Add to citation manager EndNote|Ris|BibTeX
URL: https://www.jsczz.cn/EN/10.12140/j.issn.1000-7423.2023.01.004
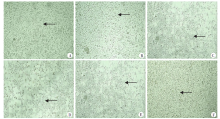
Fig. 1
Macrophages morphology post stimulation by Echinococcus granulosus antigen B and different cytokines after differentiation(× 100) A, D: M0 group and AgB group, macrophages were partially round and oval, and partially irregular; B, E: M1 group and AgB+M1 group, most of the macrophages were irregular and had antennae; C, F: M2 group and AgB+M2 group, most of the macrophages were round or oval, and few were irregular.


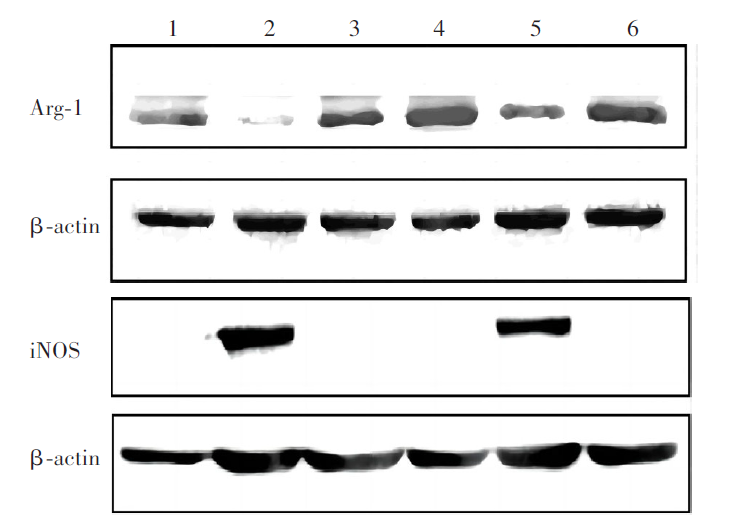
Fig. 2
Expression of Arg-1 and iNOS protein in macrophages stimulated by Echinococcus granulosus antigen B and different cytokines 1-6: M0, M1, M2, AgB, AgB+M1, AgB+M2 group.
| [1] |
Gordon S, Taylor PR. Monocyte and macrophage heterogeneity[J]. Nat Rev Immunol, 2005, 5(12): 953-964.
doi: 10.1038/nri1733 pmid: 16322748 |
| [2] | Li L, Zhuo J, Zheng L, et al. Effects of different induced polarization methods on the proliferation, apoptosis and phagocytosis of rat bone marrow-derived macrophages[J]. Chin J Tissue Eng Res, 2021, 25(25): 4032-4037. (in Chinese) |
| (李莉, 卓瑾, 郑玲, 等. 不同诱导极化方式对大鼠骨髓来源巨噬细胞增殖、凋亡及吞噬能力的影响[J]. 中国组织工程研究, 2021, 25(25): 4032-4037.) | |
| [3] | Zheng X, Wang HY. M2 macrophage polarization and the related diseases[J]. Chin Bull Life Sci, 2017, 29(9): 883-890. (in Chinese) |
| (郑新, 王红艳. M2型巨噬细胞极化及相关疾病的研究进展[J]. 生命科学, 2017, 29(9): 883-890.) | |
| [4] |
Zhao C, Mirando AC, Sové RJ, et al. A mechanistic integrative computational model of macrophage polarization: implications in human pathophysiology[J]. PLoS Comput Biol, 2019, 15(11): e1007468.
doi: 10.1371/journal.pcbi.1007468 |
| [5] | Jia R, Hui Y, Yan SG, et al. Research progress on relationship between macrophage M1/M2 polarization and immune inflammatory diseases[J]. Chin J Immunol, 2021, 37(22): 2791-2797. (in Chinese) |
| (贾瑞, 惠毅, 闫曙光, 等. 巨噬细胞M1/M2型极化与免疫炎症性疾病关系的研究进展[J]. 中国免疫学杂志, 2021, 37(22): 2791-2797.) | |
| [6] |
Mamilos A, Winter L, Schmitt VH, et al. Macrophages: from simple phagocyte to an integrative regulatory cell for inflammation and tissue regeneration: a review of the literature[J]. Cells, 2023, 12(2): 276.
doi: 10.3390/cells12020276 |
| [7] | Cai J, Huang L, Wang LJ, et al. The role of macrophage polarization in parasitic infections: a review[J]. Chin J Schisto Control, 2020, 32(4): 432-435. |
| (蔡娟, 黄琳, 王灵军, 等. 巨噬细胞极化在寄生虫感染中的作用研究进展[J]. 中国血吸虫病防治杂志, 2020, 32(4): 432-435.) | |
| [8] |
Hidalgo C, Stoore C, Baquedano MS, et al. Response patterns in adventitial layer of Echinococcus granulosus sensu stricto cysts from naturally infected cattle and sheep[J]. Vet Res, 2021, 52(1): 66.
doi: 10.1186/s13567-021-00936-8 |
| [9] |
Silva-Álvarez V, Ramos AL, Folle AM, et al. Antigen B from Echinococcus granulosus is a novel ligand for C-reactive protein[J]. Parasite Immunol, 2018, 40(9): e12575.
doi: 10.1111/pim.2018.40.issue-9 |
| [10] |
Da Silva ED, Cancela M, Monteiro KM, et al. Antigen B from Echinococcus granulosus enters mammalian cells by endocytic pathways[J]. PLoS Negl Trop Dis, 2018, 12(5): e0006473.
doi: 10.1371/journal.pntd.0006473 |
| [11] | Bao JL. Immune regulation in inflammatory bowel disease and intestinal microflora by Echinococcus granulosus infection[D]. Urumqi: Xinjiang Medical University, 2019: 37-54. (in Chinese) |
| (包建玲. 细粒棘球蚴感染对炎症性肠病的免疫调节与肠道菌群影响[D]. 乌鲁木齐: 新疆医科大学, 2019: 37-54.) | |
| [12] | Wang JH, Wang N, Hu DD, et al. Genetic diversity of Echinococcus granulosus in southwest China determined by the mitochondrial NADH dehydrogenase subunit 2 gene[J]. Sci World J, 2014, 2014: 867839. |
| [13] |
Zheng Q, Zhang JW, Zuo XS, et al. Photobiomodulation promotes neuronal axon regeneration after oxidative stress and induces a change in polarization from M1 to M2 in macrophages via stimulation of CCL2 in neurons: relevance to spinal cord injury[J]. J Mol Neurosci, 2021, 71(6): 1290-1300.
doi: 10.1007/s12031-020-01756-9 pmid: 33417168 |
| [14] | Zhang Y, Qi WJ, Jiao HJ, et al. Antigen B secreted by Echinococcus granulosus reduces asthma by rebalancing Th17/Treg[J]. J Pathog Biol, 2021, 16(8): 927-930, 933. (in Chinese) |
| (张耀, 齐文静, 焦红杰, 等. 细粒棘球绦虫分泌抗原B调控Th17/Treg抑制过敏性哮喘的研究[J]. 中国病原生物学杂志, 2021, 16(8): 927-930, 933.) | |
| [15] | AHAN Ayifuhan, Haliya, AJI Tuerganaili, et al. Protective effect of Echinococcus granulosus antigen B on low-dose streptozotocin-induced diabetes mellitus in mice[J]. J Med Postgrad, 2014, 27(5): 452-455. (in Chinese) |
| (阿依甫汗•阿汗, 哈丽娅, 吐尔干艾力•阿吉, 等. 细粒棘球蚴抗原B对1型糖尿病小鼠的保护作用[J]. 医学研究生学报, 2014, 27(5): 452-455.) | |
| [16] | Lewandowicz-Uszyńska A, Pasternak G, Świerkot J, et al. Primary immunodeficiencies: diseases of children and adults: a review[J]. Adv Exp Med Biol, 2021, 1289: 37-54. |
| [17] | Kittivisuit S, Vachvanichsanong P, McNeil E, et al. Childhood-onset systemic lupus erythematosus and immune thrombocytopenia: prevalence and risk factors[J]. Pediatr Blood Cancer, 2021, 68(8): e29146. |
| [18] |
Wang H, Li J, Pu HW, et al. Echinococcus granulosus infection reduces airway inflammation of mice likely through enhancing IL-10 and down-regulation of IL-5 and IL-17A[J]. Parasit Vectors, 2014, 7: 522.
doi: 10.1186/s13071-014-0522-6 pmid: 25409540 |
| [19] |
Głowińska-Olszewska B, Szabłowski M, Panas P, et al. Increasing co-occurrence of additional autoimmune disorders at diabetes type 1 onset among children and adolescents diagnosed in years 2010—2018-single-center study[J]. Front Endocrinol (Lausanne), 2020, 11: 476.
doi: 10.3389/fendo.2020.00476 |
| [1] | LU Junxia, XU Junying, ZHAO Bin, WANG Qianwen, LI Wenhua, GENG Yuqing, HOU Jun, WU Xiangwei, CHEN Xueling. Echinococcus granulosus infection induces macrophages to express CD73 and A2AR to suppress inflammatory response [J]. CHINESE JOURNAL OF PARASITOLOGY AND PARASITIC DISEASES, 2023, 41(5): 559-566. |
| [2] | WU Xiaoying, HU Yuan, CAO Jianping. Preparation of Echinococcus granulosus peptide embedded in chitosan quaternary ammonium salt nanoparticles [J]. CHINESE JOURNAL OF PARASITOLOGY AND PARASITIC DISEASES, 2023, 41(3): 300-305. |
| [3] | LI Benfu, WANG Zhengqing, XU Qian, ZI Jinrong, YAN Xinliu, PENG Jia, LI Jianxiong, CAI Xuan, WU Fangwei, YANG Yaming. Sequence analysis of mitochondrial co1 and nd1 genes in Echinococcus granulosus in Yunnan Province [J]. CHINESE JOURNAL OF PARASITOLOGY AND PARASITIC DISEASES, 2023, 41(3): 306-311. |
| [4] | GUO Gang, REN Yuan, JIAO Hongjie, WU Juan, GUO Baoping, QI Wenjing, LI Jun, ZHANG Wenbao. Effect of intraperitoneal inoculation with Echinococcus microcysts on the infection and pathogenicity of E. multilocularis in mouse liver [J]. CHINESE JOURNAL OF PARASITOLOGY AND PARASITIC DISEASES, 2023, 41(2): 156-162. |
| [5] | WU De-fang, FU Yong, REN Bin, ZHANG Yao-gang, XU Xiao-lei, PANG Ming-quan, FAN Hai-ning. Genetic diversity and differentiation time of human isolates of Echinococcus granulosus and E. multilocularis from Qinghai [J]. CHINESE JOURNAL OF PARASITOLOGY AND PARASITIC DISEASES, 2022, 40(5): 610-615. |
| [6] | QIAO Shi-yuan, ZHOU Xue, LIU Cheng-hao, JIANG Hui-jiao, BU Yuan-yuan, CHEN Xue-ling, WU Xiang-wei. Effect of albendazole-loaded vesicles on the vitality of protoscoleces of Echinococcus granulosus [J]. CHINESE JOURNAL OF PARASITOLOGY AND PARASITIC DISEASES, 2022, 40(3): 324-329. |
| [7] | SUN Ye-ting, JIANG Nan, JIANG Yan-yan, LI Teng, JIANG Xiao-feng, CAO Jian-ping, SHEN Yu-juan. Study on the polarization of MDSC stimulated by Echinococcus granulosus protoscolex-derived exosomes in vitro [J]. CHINESE JOURNAL OF PARASITOLOGY AND PARASITIC DISEASES, 2022, 40(2): 175-180. |
| [8] | ZHOU Wen-zheng, SUN Jun-gang, ZHAO Xi-bin, CAO Li. Therapeutic effect of intensity modulated radiation therapy on secondary femur infection with Echinococcus granulosus in rats [J]. CHINESE JOURNAL OF PARASITOLOGY AND PARASITIC DISEASES, 2021, 39(4): 443-448. |
| [9] | TIAN Meng-xiao, ZANG Xiao-yan, GUO Gang, QI Wen-jing, GUO Bao-ping, REN Yuan, LI Jun, ZHANG Wen-bao. Expression and activity assay of serine protease in Echinococcus granulosus [J]. CHINESE JOURNAL OF PARASITOLOGY AND PARASITIC DISEASES, 2021, 39(2): 233-239. |
| [10] | FAN Jun-jie, HAN Xiu-min, Nur Fazleen Binti Idris, LI Kai, TAN Qing-qing, CAO Wen-qiao, LI Xiang, LIAO Peng, YE Bin. Bioinformatics characteristics and immunoreactivity of protein kinase A of Echinococcus granulosus [J]. CHINESE JOURNAL OF PARASITOLOGY AND PARASITIC DISEASES, 2020, 38(6): 682-687. |
| [11] | SHI Chun-li, YANG Hui, PAN Wen, ZHANG Xin, ZHU Xiao-ting, ZHAO Jia-qing. Proteomic analysis of human proteins in extracellular vesicles secreted by protoscoleces of Echinococcus granulosus [J]. CHINESE JOURNAL OF PARASITOLOGY AND PARASITIC DISEASES, 2020, 38(6): 695-701. |
| [12] | YU Xiao-dong, YALI Ya-sen, WANG Jia-ling, LI Meng, YE Jian-rong. Establishment of BALB/c mouse model of Echinococcus granulosus-induced sensitization and changes of related immune cells [J]. CHINESE JOURNAL OF PARASITOLOGY AND PARASITIC DISEASES, 2020, 38(4): 412-416. |
| [13] | CAO Sheng-kui, ZHANG Xiao-fan, WEI Yu-huan, PAN Jia-ming, CAO Jian-ping, SHEN Yu-juan, CHEN Jia-xu. Expression and function of arginase in livers of mice infected with Echinococcus granulosus [J]. CHINESE JOURNAL OF PARASITOLOGY AND PARASITIC DISEASES, 2020, 38(3): 304-309. |
| [14] | ZHOU Hong-rang, MAO Guang-yao, WANG Xiao-ling, CHEN Mu-xin, YU Qing, WANG Ying, Ai Lin, XIAO Ning. Establishment and application of a multiplex recombinase-aided isothermal amplification technique for identifying Echinococcus granulosus and Echinococcus multilocularis [J]. CHINESE JOURNAL OF PARASITOLOGY AND PARASITIC DISEASES, 2020, 38(3): 310-316. |
| [15] | CHEN He-jie, JIANG Hui-jiao, LIANG Qian, Wu Jie, GUI Xian-wei, ZOU Hai-liang, XING Zhi-kun, WANG Er-qiang, CHEN Xue-ling, WU Xiang-wei. Effects of supernatant of different hepatoma cells on the vitality of Echinococcus granulosus protoscoleces in vitro [J]. CHINESE JOURNAL OF PARASITOLOGY AND PARASITIC DISEASES, 2020, 38(3): 317-323. |
| Viewed | ||||||
|
Full text |
|
|||||
|
Abstract |
|
|||||