
CHINESE JOURNAL OF PARASITOLOGY AND PARASITIC DISEASES ›› 2023, Vol. 41 ›› Issue (5): 559-566.doi: 10.12140/j.issn.1000-7423.2023.05.006
• ORIGINAL ARTICLES • Previous Articles Next Articles
LU Junxia1( ), XU Junying1, ZHAO Bin1, WANG Qianwen1, LI Wenhua1, GENG Yuqing1, HOU Jun1, WU Xiangwei1,2, CHEN Xueling1,*()
Received:2023-04-26
Revised:2023-09-09
Online:2023-10-30
Published:2023-11-06
Contact:
*E-mail: Supported by:CLC Number:
LU Junxia, XU Junying, ZHAO Bin, WANG Qianwen, LI Wenhua, GENG Yuqing, HOU Jun, WU Xiangwei, CHEN Xueling. Echinococcus granulosus infection induces macrophages to express CD73 and A2AR to suppress inflammatory response[J]. CHINESE JOURNAL OF PARASITOLOGY AND PARASITIC DISEASES, 2023, 41(5): 559-566.
Add to citation manager EndNote|Ris|BibTeX
URL: https://www.jsczz.cn/EN/10.12140/j.issn.1000-7423.2023.05.006
Table 1
Primer sequences for qRT-PCR
| 基因 Gene | 引物序列(5'→3') Sequence primer (5'→3') |
|---|---|
| CD73 | F:CTCTGCACCAAGTGTCGAGT |
| R:CTCCACCGTTGGCCAGATAG | |
| A2A受体 A2AR | F:CTGCAGAACGTCACCAACTT |
| R:GCGATGTATCTGTCGATGGC | |
| 肿瘤坏死因子α TNF-α | F:CCTGTAGCCCACGTCGTAG |
| R:GGGAGTGAGCAAGGTACAACCC | |
| 精氨酸酶1 Arg-1 | F:CTCCAAGCCAAAGTCCTTAGAG |
| R:AGGAGCTGTCATTAGGGACATC | |
| β-actin | F:GGCTATGCTCTCCCTCACG |
| R:GAGCAACATAGCACAGCTTCTCTTT |
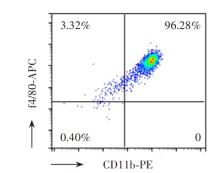
Fig. 1
The purity of peritoneal macrophages in C57BL/6 mice was detected by flow cytometry


Fig. 2
The expression level of CD73 in macrophages co-cultured with E. granulosus cyst fluid detected by flow cytometry
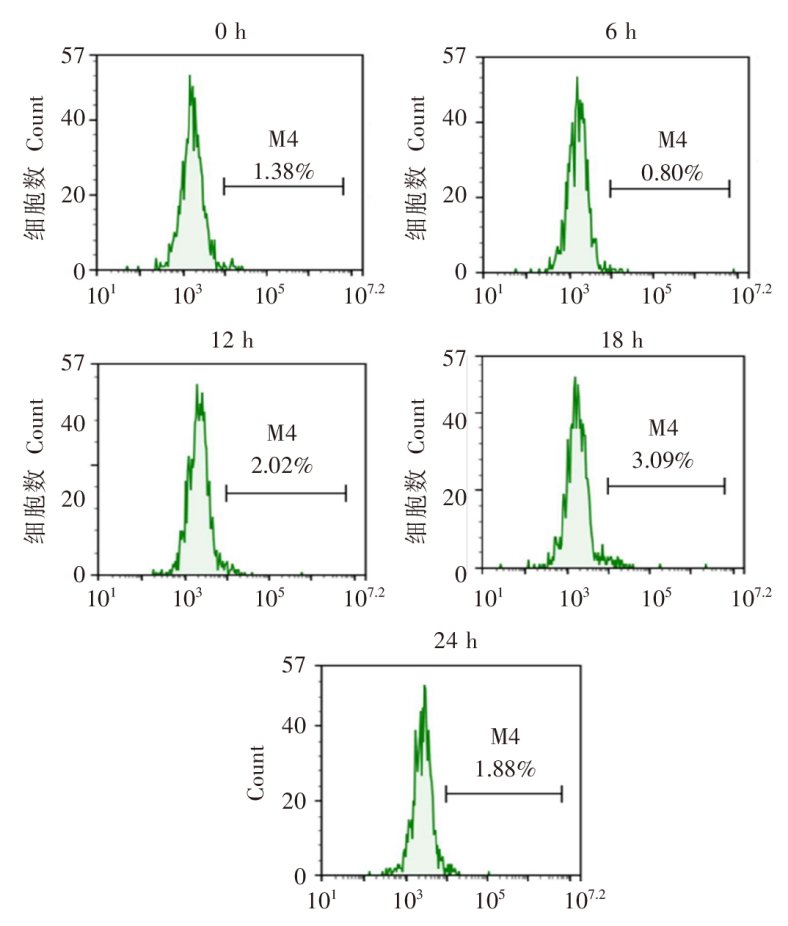
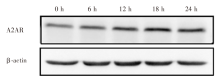
Fig. 3
The expression level of A2AR protein in macrophages co-cultured with E. granulosus cyst fluid detected by Western blotting
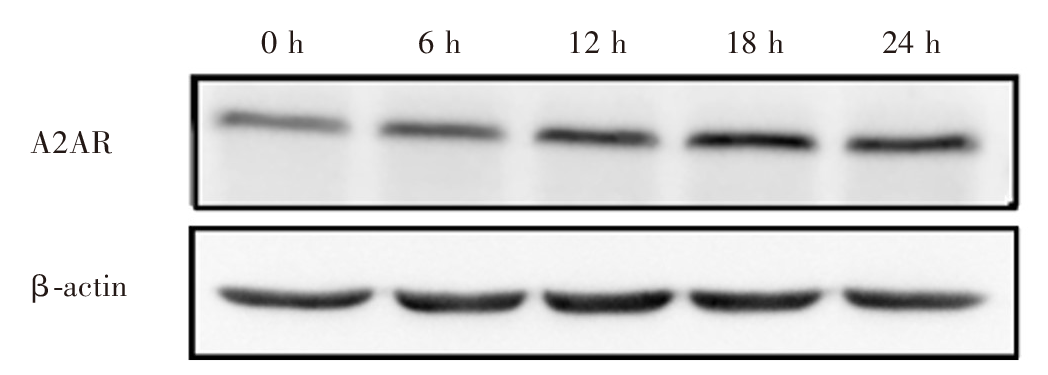
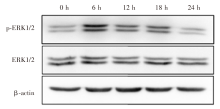
Fig. 4
The expression of ERK1/2 protein in macrophages co-cultured with E. granulosus cyst fluid detected by Western blotting
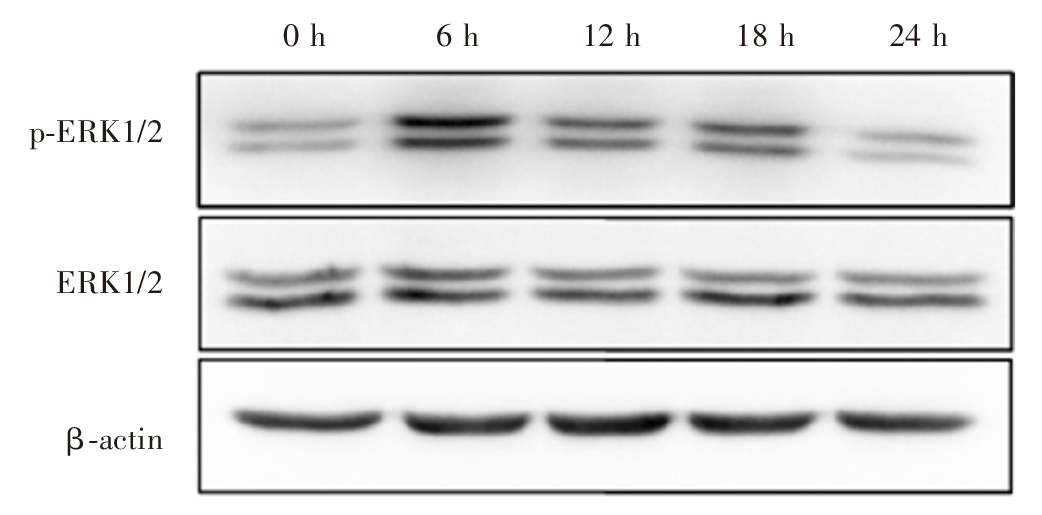
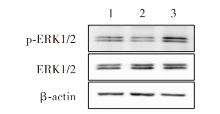
Fig. 5
Effects of adenosine receptors on expression of ERK1/2 protein in macrophages treated with E. granulosus cyst fluid by Western blotting 1-3: control group, capsule fluid group, and drug group.
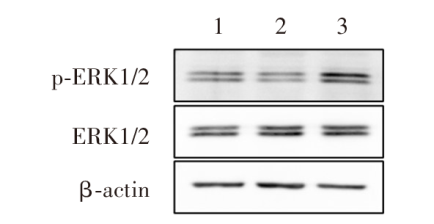
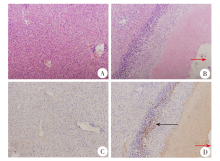
Fig. 6
The expression of A2AR in liver tissue of mice infected with E. granulosus (A, B: HE staining, × 100; C, D: Immunohistochemical staining, × 100) A, C: The arrangement of liver cells in healthy mice is regular, and the nuclei are clearly visible; B: Inflammatory cell infiltration zone in liver tissue of infected mice; D: The infected group showed brownish-yellow inflammatory cells around the vesicles. ↑: inside measurement; ↑: Positive cells.

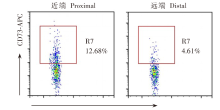
Fig. 7
Proportion of CD73+ macrophages in proximal (< 0.5 cm) and distal (> 2 cm) vesicles of mice infected with E. granulosus by flow cytometry
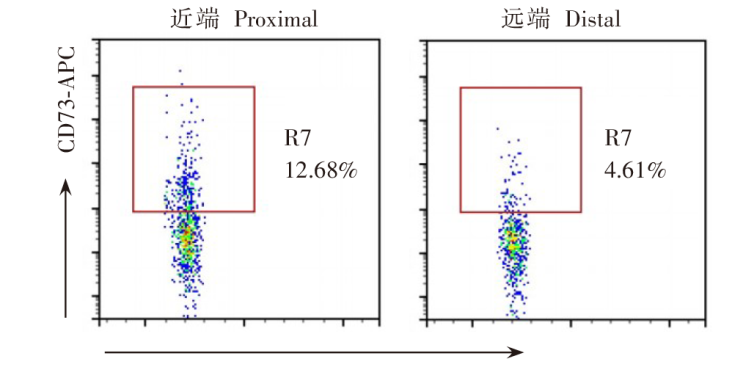

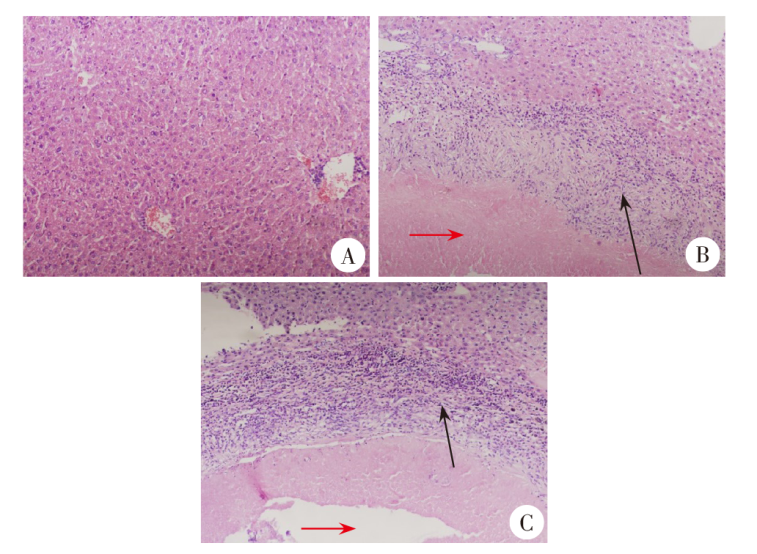
Fig. 8
Inflammatory cell infiltration around the vesicles in mice infected with E. granulosus treated by adenosine A2A receptor antagonist (HE staining, × 100) A: In the healthy group, the liver cells were arranged regularly and the nuclei were clearly visible; B: There were a small number of inflammatory cells around the vesicles in the solvent group; C: Perivesicular inflammatory cells increased significantly in the administration group. ↑: Inside vesicles; ↑: Bands of inflammatory cells.
| [1] | Wen H, Vuitton L, Tuxun T, et al. Echinococcosis: advances in the 21st century[J]. Clin Microbiol Rev, 2019, 32(2): e00075. |
| [2] |
Peters L, Burkert S, Grüner B. Parasites of the liver: epidemiology, diagnosis and clinical management in the European context[J]. J Hepatol, 2021, 75(1): 202-218.
doi: 10.1016/j.jhep.2021.02.015 pmid: 33636243 |
| [3] | Gottstein B, Soboslay P, Ortona E, et al. Immunology of alveolar and cystic echinococcosis (AE and CE)[J]. Adv Parasitol, 2017, 96: 1-54. |
| [4] | Siracusano A, Teggi A, Ortona E. Human cystic echinococcosis: old problems and new perspectives[J]. Interdiscip Perspect Infect Dis, 2009, 2009: 474368. |
| [5] |
Li LF, Wang LP, Li JY, et al. Metformin-induced reduction of CD39 and CD73 blocks myeloid-derived suppressor cell activity in patients with ovarian cancer[J]. Cancer Res, 2018, 78(7): 1779-1791.
doi: 10.1158/0008-5472.CAN-17-2460 pmid: 29374065 |
| [6] |
Antonioli L, Pacher P, Vizi ES, et al. CD39 and CD73 in immunity and inflammation[J]. Trends Mol Med, 2013, 19(6): 355-367.
doi: 10.1016/j.molmed.2013.03.005 pmid: 23601906 |
| [7] |
Sun CF, Wang BC, Hao SL. Adenosine-A2A receptor pathway in cancer immunotherapy[J]. Front Immunol, 2022, 13: 837230.
doi: 10.3389/fimmu.2022.837230 |
| [8] |
Kazemi MH, Raoofi Mohseni S, Hojjat-Farsangi M, et al. Adenosine and adenosine receptors in the immunopathogenesis and treatment of cancer[J]. J Cell Physiol, 2018, 233(3): 2032-2057.
doi: 10.1002/jcp.25873 pmid: 28233320 |
| [9] |
Antonioli L, Blandizzi C, Pacher P, et al. Immunity, inflammation and cancer: a leading role for adenosine[J]. Nat Rev Cancer, 2013, 13(12): 842-857.
doi: 10.1038/nrc3613 pmid: 24226193 |
| [10] |
Ghalamfarsa G, Kazemi MH, Raoofi Mohseni S, et al. CD73 as a potential opportunity for cancer immunotherapy[J]. Expert Opin Ther Targets, 2019, 23(2): 127-142.
doi: 10.1080/14728222.2019.1559829 |
| [11] | Zeng JR, Ning ZC, Wang YZ, et al. Implications of CD39 in immune-related diseases[J]. Int Immunopharmacol, 2020, 89(Pt A): 107055. |
| [12] |
Chen B, Yan MZ, Gao HJ, et al. In vitro and in vivo efficacies of novel harmine derivatives in the treatment of cystic echinococcosis[J]. Drug Des Devel Ther, 2023, 17: 2441-2454.
doi: 10.2147/DDDT.S419002 |
| [13] |
Wu JC, Zhu YQ, Zhou LM, et al. Parasite-derived excretory-secretory products alleviate gut microbiota dysbiosis and improve cognitive impairment induced by a high-fat diet[J]. Front Immunol, 2021, 12: 710513.
doi: 10.3389/fimmu.2021.710513 |
| [14] |
Xiao J, Zhu YZ, Wu JW, et al. Expression profiling of exosomal miRNAs derived from different stages of infection in mice infected with Echinococcus granulosus protoscoleces using high-throughput sequencing[J]. Parasitol Res, 2022, 121(7): 1993-2008.
doi: 10.1007/s00436-022-07536-1 |
| [15] |
Jayasingam SD, Citartan M, Thang TH, et al. Evaluating the polarization of tumor-associated macrophages into M1 and M2 phenotypes in human cancer tissue: technicalities and challenges in routine clinical practice[J]. Front Oncol, 2019, 9: 1512.
doi: 10.3389/fonc.2019.01512 pmid: 32039007 |
| [16] |
Skytthe MK, Graversen JH, Moestrup SK. Targeting of CD163+ macrophages in inflammatory and malignant diseases[J]. Int J Mol Sci, 2020, 21(15): 5497.
doi: 10.3390/ijms21155497 |
| [17] |
Ma SR, Deng WW, Liu JF, et al. Blockade of adenosine A2A receptor enhances CD8+ T cells response and decreases regulatory T cells in head and neck squamous cell carcinoma[J]. Mol Cancer, 2017, 16(1): 99.
doi: 10.1186/s12943-017-0665-0 |
| [18] |
Vincenzi F, Pasquini S, Contri C, et al. Pharmacology of adenosine receptors: recent advancements[J]. Biomolecules, 2023, 13(9): 1387.
doi: 10.3390/biom13091387 |
| [19] |
Csóka B, Selmeczy Z, Koscsó B, et al. Adenosine promotes alternative macrophage activation via A2A and A2B receptors[J]. FASEB J, 2012, 26(1): 376-386.
doi: 10.1096/fj.11-190934 pmid: 21926236 |
| [20] |
Bach N, Winzer R, Tolosa E, et al. The clinical significance of CD73 in cancer[J]. Int J Mol Sci, 2023, 24(14): 11759.
doi: 10.3390/ijms241411759 |
| [21] |
Cai JN, Wang YL, Sheng XD, et al. Shufeng Jiedu capsule inhibits inflammation and apoptosis by activating A2AAR and inhibiting NF-κB to alleviate LPS-induced ALI[J]. J Ethnopharmacol, 2022, 298: 115661.
doi: 10.1016/j.jep.2022.115661 |
| [22] |
Wang LQ, Zhang WT, Cen RY, et al. ALA-PDT regulates macrophage M1 polarization via ERK/MAPK-NLRP3 pathway to promote the early inflammatory response[J]. Lasers Surg Med, 2022, 54(10): 1309-1320.
doi: 10.1002/lsm.23618 pmid: 36403288 |
| [1] | WU Xiaoying, HU Yuan, CAO Jianping. Preparation of Echinococcus granulosus peptide embedded in chitosan quaternary ammonium salt nanoparticles [J]. CHINESE JOURNAL OF PARASITOLOGY AND PARASITIC DISEASES, 2023, 41(3): 300-305. |
| [2] | LI Benfu, WANG Zhengqing, XU Qian, ZI Jinrong, YAN Xinliu, PENG Jia, LI Jianxiong, CAI Xuan, WU Fangwei, YANG Yaming. Sequence analysis of mitochondrial co1 and nd1 genes in Echinococcus granulosus in Yunnan Province [J]. CHINESE JOURNAL OF PARASITOLOGY AND PARASITIC DISEASES, 2023, 41(3): 306-311. |
| [3] | GUO Gang, REN Yuan, JIAO Hongjie, WU Juan, GUO Baoping, QI Wenjing, LI Jun, ZHANG Wenbao. Effect of intraperitoneal inoculation with Echinococcus microcysts on the infection and pathogenicity of E. multilocularis in mouse liver [J]. CHINESE JOURNAL OF PARASITOLOGY AND PARASITIC DISEASES, 2023, 41(2): 156-162. |
| [4] | JIAO Hongjie, QI Wenjing, GUO Gang, BAO Jianling, WU Chuanchuan, SONG Chuanlong, LI Jun, ZHANG Wenbao, YAN Mei. Polarization effect of Echinococcus granulosus antigen B on the mouse macrophage RAW264.7 [J]. CHINESE JOURNAL OF PARASITOLOGY AND PARASITIC DISEASES, 2023, 41(1): 23-28. |
| [5] | LI Jia-ming, WANG Yi-xuan, YANG Ning-ai, MA Hui-hui, LAN Min, LIU Chun-lan, ZHAO Zhi-jun. Effects of ROP16 protein of Toxoplasma gondii on polarization and apoptosis of MH-S cells and their related mechanisms [J]. CHINESE JOURNAL OF PARASITOLOGY AND PARASITIC DISEASES, 2022, 40(5): 579-586. |
| [6] | WU De-fang, FU Yong, REN Bin, ZHANG Yao-gang, XU Xiao-lei, PANG Ming-quan, FAN Hai-ning. Genetic diversity and differentiation time of human isolates of Echinococcus granulosus and E. multilocularis from Qinghai [J]. CHINESE JOURNAL OF PARASITOLOGY AND PARASITIC DISEASES, 2022, 40(5): 610-615. |
| [7] | QIAO Shi-yuan, ZHOU Xue, LIU Cheng-hao, JIANG Hui-jiao, BU Yuan-yuan, CHEN Xue-ling, WU Xiang-wei. Effect of albendazole-loaded vesicles on the vitality of protoscoleces of Echinococcus granulosus [J]. CHINESE JOURNAL OF PARASITOLOGY AND PARASITIC DISEASES, 2022, 40(3): 324-329. |
| [8] | SUN Ye-ting, JIANG Nan, JIANG Yan-yan, LI Teng, JIANG Xiao-feng, CAO Jian-ping, SHEN Yu-juan. Study on the polarization of MDSC stimulated by Echinococcus granulosus protoscolex-derived exosomes in vitro [J]. CHINESE JOURNAL OF PARASITOLOGY AND PARASITIC DISEASES, 2022, 40(2): 175-180. |
| [9] | ZHOU Wen-zheng, SUN Jun-gang, ZHAO Xi-bin, CAO Li. Therapeutic effect of intensity modulated radiation therapy on secondary femur infection with Echinococcus granulosus in rats [J]. CHINESE JOURNAL OF PARASITOLOGY AND PARASITIC DISEASES, 2021, 39(4): 443-448. |
| [10] | ZHAO Cheng-si, QIN Min, TAN Ming-juan, MIAO Ting-ting, SHAO Tian-ye, LIU Xin-jian, WANG Yong. Effect of praziquantel on impaired renal function in mice with acute infection of Schistosoma japonicum [J]. CHINESE JOURNAL OF PARASITOLOGY AND PARASITIC DISEASES, 2021, 39(2): 200-209. |
| [11] | TIAN Meng-xiao, ZANG Xiao-yan, GUO Gang, QI Wen-jing, GUO Bao-ping, REN Yuan, LI Jun, ZHANG Wen-bao. Expression and activity assay of serine protease in Echinococcus granulosus [J]. CHINESE JOURNAL OF PARASITOLOGY AND PARASITIC DISEASES, 2021, 39(2): 233-239. |
| [12] | FAN Jun-jie, HAN Xiu-min, Nur Fazleen Binti Idris, LI Kai, TAN Qing-qing, CAO Wen-qiao, LI Xiang, LIAO Peng, YE Bin. Bioinformatics characteristics and immunoreactivity of protein kinase A of Echinococcus granulosus [J]. CHINESE JOURNAL OF PARASITOLOGY AND PARASITIC DISEASES, 2020, 38(6): 682-687. |
| [13] | SHI Chun-li, YANG Hui, PAN Wen, ZHANG Xin, ZHU Xiao-ting, ZHAO Jia-qing. Proteomic analysis of human proteins in extracellular vesicles secreted by protoscoleces of Echinococcus granulosus [J]. CHINESE JOURNAL OF PARASITOLOGY AND PARASITIC DISEASES, 2020, 38(6): 695-701. |
| [14] | YU Xiao-dong, YALI Ya-sen, WANG Jia-ling, LI Meng, YE Jian-rong. Establishment of BALB/c mouse model of Echinococcus granulosus-induced sensitization and changes of related immune cells [J]. CHINESE JOURNAL OF PARASITOLOGY AND PARASITIC DISEASES, 2020, 38(4): 412-416. |
| [15] | CAO Sheng-kui, ZHANG Xiao-fan, WEI Yu-huan, PAN Jia-ming, CAO Jian-ping, SHEN Yu-juan, CHEN Jia-xu. Expression and function of arginase in livers of mice infected with Echinococcus granulosus [J]. CHINESE JOURNAL OF PARASITOLOGY AND PARASITIC DISEASES, 2020, 38(3): 304-309. |
| Viewed | ||||||
|
Full text |
|
|||||
|
Abstract |
|
|||||