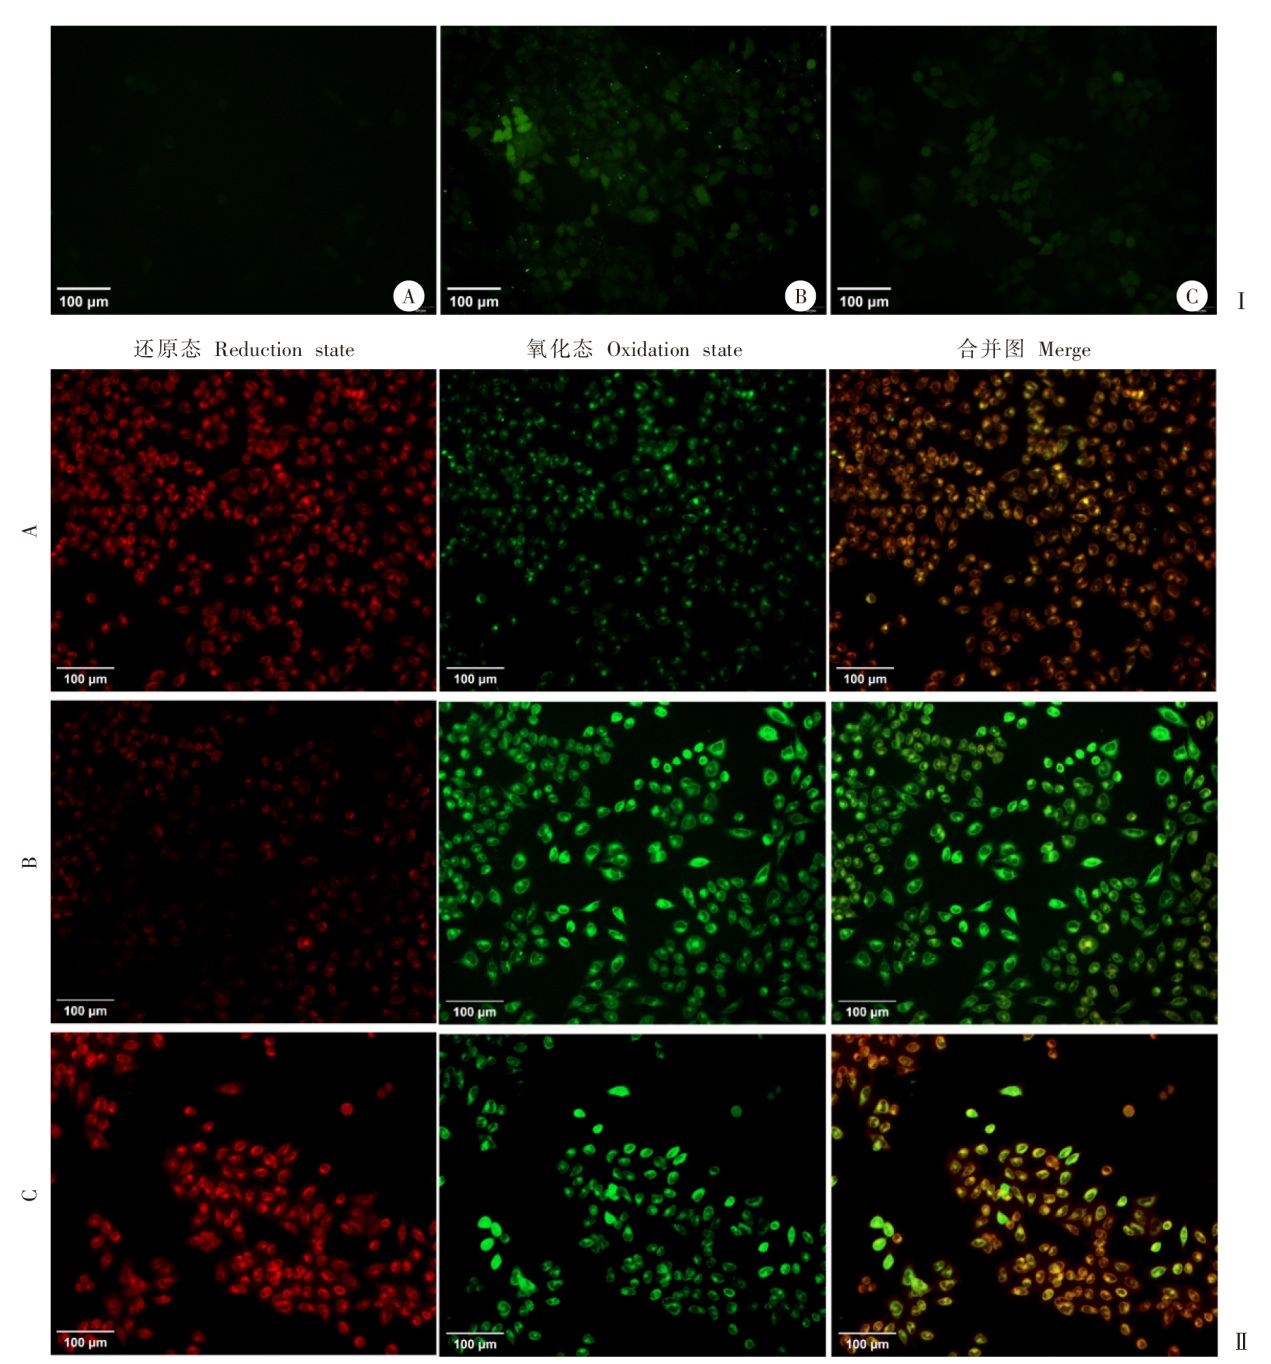
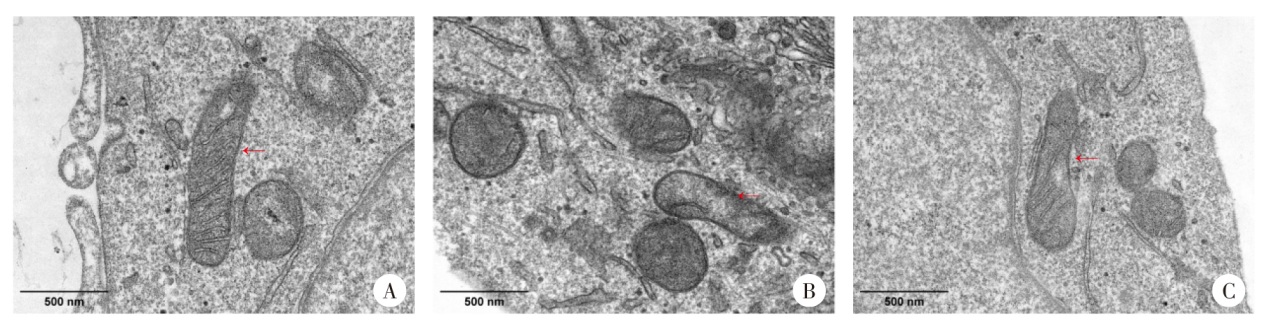
| [1] | World Health Organization. Allergic diseases and asthma: A global public health concern[R]. Geneva: World Health Organization, 2003. | | [2] | Hang YQ, Piao X, Wu J, et al. The epidemiology of asthma and its attributable risk factors from 1990 to 2021: A systematic analysis based on the global burden of disease study 2021 and mendelian randomization studies[J]. Public Health, 2025, 243: 105731. | | [3] | Liu JX, Zhang Y, Yuan HY, et al. The treatment of asthma using the Chinese Materia Medica[J]. J Ethnopharmacol, 2021, 269: 113558. | | [4] | Yang L, Zhu RF. Immunotherapy of house dust mite allergy[J]. Hum Vaccin Immunother, 2017, 13(10): 2390-2396. | | [5] | 李启松, 杨李, 腾飞翔, 等. 屋尘螨过敏原Der p 4的克隆、表达、免疫原性鉴定及生物信息学分析[J]. 中国寄生虫学与寄生虫病杂志, 2024, 42(1): 42-47. | | | Li QS, Yang L, Teng FX, et al. Cloning, expression, immunogenicity identification and bioinformatics analysis of Dermatophagoides pteronyssinus allergen Der p 4[J]. Chin J Parasitol Parasit Dis, 2024, 42(1): 42-47. (in Chinese) | | [6] | 万极硕, 卢山, 杨凯楠. 北京市昌平地区5 068例过敏原特异性IgE抗体检测结果分析[J]. 标记免疫分析与临床, 2021, 28(3): 385-390, 394. | | | Wan JS, Lu S, Yang KN. Analysis of detection results of allergen-specific IgE antibody in 5 068 cases in Changping district of Beijing[J]. Labeled Immunoass Clin Med, 2021, 28(3): 385-390, 394. (in Chinese) | | [7] | Witt C, Stuckey MS, Woolcock AJ, et al. Positive allergy prick tests associated with bronchial histamine responsiveness in an unselected population[J]. J Allergy Clin Immunol, 1986, 77(5): 698-702. | | [8] | Jacquet A. Innate immune responses in house dust mite allergy[J]. ISRN Allergy, 2013, 2013: 735031. | | [9] | Liu S, Cai ZL, Liu JC, et al. The novel house dust mite allergen Der p 39 exacerbates atopic dermatitis-like inflammation in mice by inducing skin barrier dysfunction[J]. World Allergy Organ J, 2025, 18(3): 101036. | | [10] | Kl?ditz K, Fadeel B. Three cell deaths and a funeral: Macrophage clearance of cells undergoing distinct modes of cell death[J]. Cell Death Discov, 2019, 5: 65. | | [11] | Deng LY, He SS, Guo NQ, et al. Molecular mechanisms of ferroptosis and relevance to inflammation[J]. Inflamm Res, 2023, 72(2): 281-299. | | [12] | He YX, Wang JY, Ying CM, et al. The interplay between ferroptosis and inflammation: Therapeutic implications for cerebral ischemia-reperfusion[J]. Front Immunol, 2024, 15: 1482386. | | [13] | Zeng ZJ, Huang HH, Zhang JM, et al. HDM induce airway epithelial cell ferroptosis and promote inflammation by activating ferritinophagy in asthma[J]. FASEB J, 2022, 36(6): e22359. | | [14] | Park M, Park S, Choi Y, et al. The mechanism underlying correlation of particulate matter-induced ferroptosis with inflammasome activation and iron accumulation in macrophages[J]. Cell Death Discov, 2024, 10(1): 144. | | [15] | Huang HJ, Sarzsinszky E, Vrtala S. House dust mite allergy: The importance of house dust mite allergens for diagnosis and immunotherapy[J]. Mol Immunol, 2023, 158: 54-67. | | [16] | Jinson S, Zhang ZY, Lancaster GI, et al. Iron, lipid peroxidation, and ferroptosis play pathogenic roles in atherosclerosis[J]. Cardiovasc Res, 2025, 121(1): 44-61. | | [17] | Murdaca G, Greco M, Tonacci A, et al. IL-33/IL-31 axis in immune-mediated and allergic diseases[J]. Int J Mol Sci, 2019, 20(23): 5856. | | [18] | Han MY, Rajput C, Hong JY, et al. The innate cytokines IL-25, IL-33, and TSLP cooperate in the induction of type 2 innate lymphoid cell expansion and mucous Metaplasia in rhinovirus-infected immature mice[J]. J Immunol, 2017, 199(4): 1308-1318. | | [19] | Spiric J, Reuter A, Rabin RL. Mass spectrometry to complement standardization of house dust mite and other complex allergenic extracts[J]. Clin Exp Allergy, 2017, 47(5): 604-617. | | [20] | 王晓艳, 普晓瑜, 陈力嘉, 等. 尘螨致敏蛋白组分在变应性鼻炎和哮喘中的差异及其临床意义[J]. 临床耳鼻咽喉头颈外科杂志, 2022, 36(8): 576-581. | | | Wang XY, Pu XY, Chen LJ, et al. Difference of allergenic protein components of dust mite in allergic rhinitis and asthma and its clinical significance[J]. J Clin Otorhinolaryngol Head Neck Surg, 2022, 36(8): 576-581. (in Chinese) | | [21] | Hsin L, Varese N, Aui PM, et al. Accurate determination of house dust mite sensitization in asthma and allergic rhinitis through cytometric detection of Der p 1 and Der p 2 binding on basophils (CytoBas)[J]. J Allergy Clin Immunol, 2024, 153(5): 1282-1291. | | [22] | Wan H, Winton HL, Soeller C, et al. Der p 1 facilitates transepithelial allergen delivery by disruption of tight junctions[J]. J Clin Invest, 1999, 104(1): 123-133. | | [23] | Gong ZH, Wang YJ, Li L, et al. Cardamonin alleviates chondrocytes inflammation and cartilage degradation of osteoarthritis by inhibiting ferroptosis via p53 pathway[J]. Food Chem Toxicol, 2023, 174: 113644. | | [24] | Duo H, Yang YW, Luo J, et al. Correction: Modulatory role of radioprotective 105 in mitigating oxidative stress and ferroptosis via the HO-1/SLC7A11/GPX4 axis in sepsis-mediated renal injury[J]. Cell Death Discov, 2025, 11(1): 409. |
|

 )(
)( ), ZANG Xiao1, MEI Wei1, MA Lianzheng2, RAO Lina1, HONG Shanchao3,*(