
CHINESE JOURNAL OF PARASITOLOGY AND PARASITIC DISEASES ›› 2021, Vol. 39 ›› Issue (1): 35-42.doi: 10.12140/j.issn.1000-7423.2021.01.005
• ORIGINAL ARTICLES • Previous Articles Next Articles
MA Zhi-qiang1,4( ), WANG Lin1, LI Sheng-hao1, XU Jing-jing1, LI Cai-xin1, LIU Yuan1, ZHANG Yan-ling1, SHU Qiu-hong2, ZHUANG Shan-shan3, HE Shu Mei-qi4, WANG Wen-lin4, WANG Wei-qun4,*()
Received:2020-06-16
Revised:2020-08-20
Online:2021-02-28
Published:2021-03-10
Contact:
WANG Wei-qun
E-mail:18468279606@163.com;weiqunyjs@126.com
Supported by:CLC Number:
MA Zhi-qiang, WANG Lin, LI Sheng-hao, XU Jing-jing, LI Cai-xin, LIU Yuan, ZHANG Yan-ling, SHU Qiu-hong, ZHUANG Shan-shan, HE Shu Mei-qi, WANG Wen-lin, WANG Wei-qun. Preliminary study on autophagy of lung tissue cells in rats infected with Paragonimus proliferus[J]. CHINESE JOURNAL OF PARASITOLOGY AND PARASITIC DISEASES, 2021, 39(1): 35-42.
Add to citation manager EndNote|Ris|BibTeX
URL: https://www.jsczz.cn/EN/10.12140/j.issn.1000-7423.2021.01.005
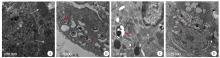
Fig. 1
TEM observation of rat lung tissue cells after Paragonimus proliferus infection A: Control group; B: 3 days after infection; C: 7 days after infection; D: 17 days after infection. White arrows indicate mitochondria, and red arrows indicate the depolarized mitochondria and autophagolysosomes.
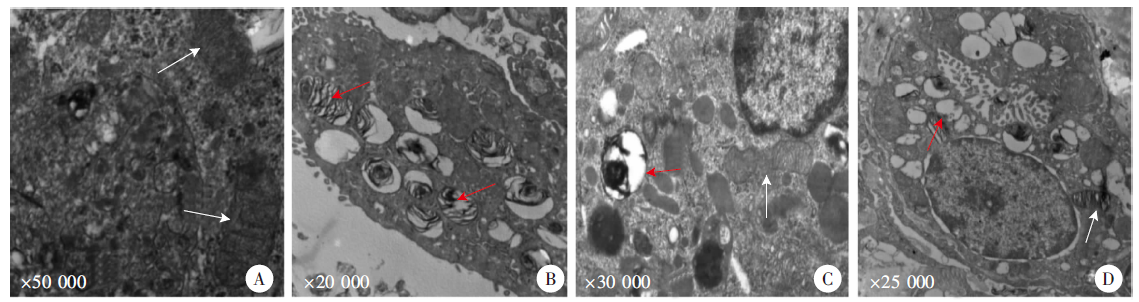
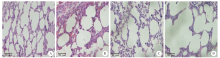
Fig. 2
Pathological changes of lung tissues after Paragonimus proliferus infection(HE staining, × 400) A: Cells with normal alveolar structure were arranged neatly; B: Slightly damaged alveolar structure on day 3 after infection; C: Disordered distribution of alveolar cells on day 7 after infection; D: Severe alveolar structural damage on day 14 after infection.
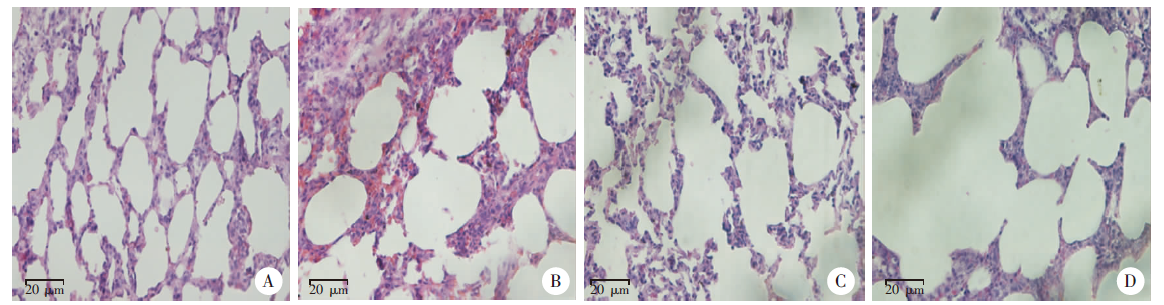
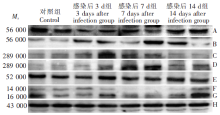
Fig. 3
Western blotting of autophagy protein expression in lungs of rats infected with Paragonimus proliferus A: Akt; B: p-Aktser473; C: mTOR; D: p-mTORser2448; E: Beclin 1; F: LC3Ⅰ;G: LC3Ⅱ; H: β-Actin.
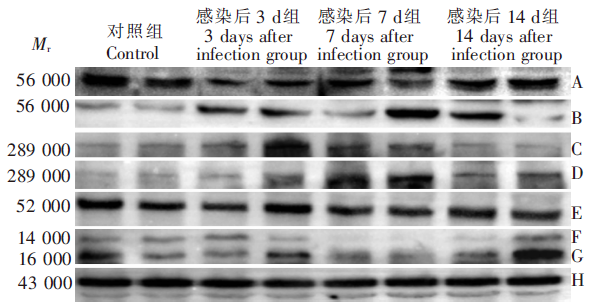
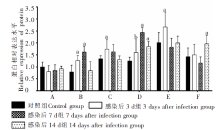
Fig. 4
Results of autophagy protein expression in lungs of rats infected with Paragonimus proliferus A: Akt; B: p-Aktser473; C: mTOR; D: p-mTORser2448; E: Beclin 1; F: LC3Ⅱ.
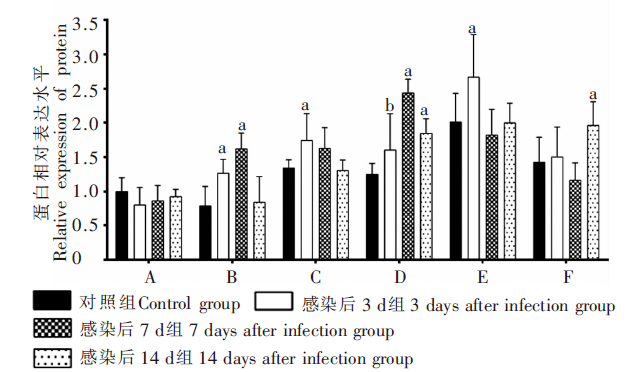
Table 1
Absorbance of lung autophagy proteins in rats infected with Paragonimus proliferus
| 相关因子Correlation factor | 对照组 Control group | 感染后3 d组 3 days after infection group | 感染后7 d组 7 days after infection group | 感染后14 d组 14 days after infection group |
|---|---|---|---|---|
| A | 0.029 ± 0.003 | 0.031 ± 0.002 | 0.032 ± 0.002 | 0.031 ± 0.002 |
| B | 0.032 ± 0.001 | 0.104 ± 0.010a | 0.143 ± 0.022a | 0.088 ± 0.013a |
| C | 0.074 ± 0.002 | 0.077 ± 0.003 | 0.075 ± 0.002 | 0.071 ± 0.003 |
| D | 0.065 ± 0.002 | 0.100 ± 0.007b | 0.151 ± 0.006a | 0.120 ± 0.012a |
| E | 0.031 ± 0.001 | 0.129 ± 0.005a | 0.047 ± 0.004b | 0.050 ± 0.005b |
| F | 0.042 ± 0.004 | 0.056 ± 0.006b | 0.048 ± 0.002 | 0.120 ± 0.007a |
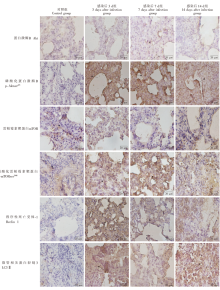
Fig. 5
Expression of autophagy proteins in lung tissues of rats infected with Paragonimus proliferus (× 400) Note:The positive staining in brown yellow. Proteins stained positive were all located in the cell membrane and cytoplasm.

| [1] | Hu KM, Zheng B, Chen SH, et al. Progress in the identification of Paragonimus species by DNA technology[J]. Chin J Parasitol Parasit Dis, 2019,37(5):598-602. (in Chinese) |
| ( 胡坤敏, 郑彬, 陈韶红, 等. 并殖吸虫DNA分类技术的研究进展[J]. 中国寄生虫学与寄生虫病杂志, 2019,37(5):598-602.) | |
| [2] | Liu Q, Zhang H, Zhao YM, et al. Clinical, pathologic and radiologic analysis of paragonimiasis in children[J]. Chin J Pathol, 2017,46(2):108-111. (in Chinese) |
| ( 刘琦, 章虎, 赵一鸣, 等. 儿童肺吸虫病临床、病理及影像学分析[J]. 中华病理学杂志, 2017,46(2):108-111.) | |
| [3] | Luo J, Wang MY, Liu D, et al. Pulmonary paragonimiasis mimicking tuberculous pleuritis: a case report[J]. Medicine (Madr), 2016,95(15):e3436. |
| [4] |
Itoh N, Tsukahara M, Yamasaki H, et al. Paragonimus westermani infection mimicking recurrent lung cancer: a case report[J]. J Infect Chemother, 2016,22(12):815-818.
doi: 10.1016/j.jiac.2016.07.002 pmid: 27498617 |
| [5] |
Green DR. The pathophysiology of mitochondrial cell death[J]. Science, 2004,305(5684):626-629.
doi: 10.1126/science.1099320 pmid: 15286356 |
| [6] |
Stetler RA, Leak RK, Gao YQ, et al. The dynamics of the mitochondrial organelle as a potential therapeutic target[J]. J Cereb Blood Flow Metab, 2013,33(1):22-32.
doi: 10.1038/jcbfm.2012.158 pmid: 23093069 |
| [7] |
Cai Z, Yan LJ. Rapamycin, autophagy, and alzheimer’s disease[J]. J Biochem Pharmacol Res, 2013,1(2):84-90.
pmid: 23826514 |
| [8] |
Sehgal SN, Baker H, Vézina C. Rapamycin (AY-22, 989), a new antifungal antibiotic. Ⅱ. Fermentation, isolation and characterization[J]. J Antibiot, 1975,28(10):727-732.
doi: 10.7164/antibiotics.28.727 |
| [9] |
Alers S, Löffler AS, Wesselborg S, et al. Role of AMPK-mTOR-Ulk1/2 in the regulation of autophagy: cross talk, shortcuts, and feedbacks[J]. Mol Cell Biol, 2012,32(1):2-11.
doi: 10.1128/MCB.06159-11 |
| [10] |
Wan G, Xie WD, Liu ZY, et al. Hypoxia-induced MIR155 is a potent autophagy inducer by targeting multiple players in the MTOR pathway[J]. Autophagy, 2014,10(1):70-79.
doi: 10.4161/auto.26534 |
| [11] | Yuan XM, Liu ZY, Liu CF, et al. Investigation on paragonimiasis in Kaijiang County of Sichuan Province, 2013[J]. Mod Prev Med, 2015,42(9):1555-1558. (in Chinese) |
| ( 袁小明, 刘自远, 刘成福, 等. 2013年开江县肺吸虫病流行病学调查[J]. 现代预防医学, 2015,42(9):1555-1558.) | |
| [12] | Yang YR, Liang HD. Prevalence and risk factors of intestinal parasites in cats from China[J]. Biomed Res Int, 2015,2015:1-5. |
| [13] |
Liu Q, Wei F, Liu WS, et al. Paragonimiasis: an important food-borne zoonosis in China[J]. Trends Parasitol, 2008,24(7):318-323.
doi: 10.1016/j.pt.2008.03.014 |
| [14] |
Stromberg PC, Dubey JP. The life cycle of Paragonimus kellicotti in cats[J]. J Parasitol, 1978,64(6):998-1002.
pmid: 739320 |
| [15] |
Bestebroer J, V′Kovski P, Mauthe M, et al. Hidden behind autophagy: the unconventional roles of ATG proteins[J]. Traffic, 2013,14(10):1029-1041.
doi: 10.1111/tra.12091 pmid: 23837619 |
| [16] |
Bhattacharya A, Biswas A, Das PK. Identification of a protein kinase a regulatory subunit from Leishmania having importance in metacyclogenesis through induction of autophagy[J]. Mol Microbiol, 2012,83(3):548-564.
doi: 10.1111/j.1365-2958.2011.07950.x |
| [17] |
Yang L, Xiao L, Chen LX. Research progress of autophagy and pulmonary diseases[J]. Prog Biochem Biophys, 2012,39(9):861-868. (in Chinese)
doi: 10.3724/SP.J.1206.2011.00429 |
|
( 杨莉, 肖凌, 陈临溪. 自噬与肺部疾病研究进展[J]. 生物化学与生物物理进展, 2012,39(9):861-868.)
doi: 10.3724/SP.J.1206.2011.00429 |
|
| [18] | Wang NN, Tan YZ, Wang HJ. Effect of nutritional stress on autophagy in free-living Amoeba[J]. Chin J Parasitol Parasit Dis, 2010,28(6):427-430. (in Chinese) |
| ( 王南宁, 谭玉珍, 王海杰. 营养缺乏对自由生活阿米巴自噬的影响[J]. 中国寄生虫学与寄生虫病杂志, 2010,28(6):427-430.) |
| [1] | XUE Yushan, LIN Ping, CHENG Xunjia, FENG Meng. Damage caused by chronic infection of Toxoplasma gondii on the host central nervous system and its mechanism [J]. CHINESE JOURNAL OF PARASITOLOGY AND PARASITIC DISEASES, 2023, 41(5): 527-531. |
| [2] | GUO Shuai, HE Biao, GAO Yuanli, FAN Yongling, ZHU Feng, DING Yan, LIU Taiping, XU Wenyue. Specie-specific analysis of plasmodia infecting rats and mice [J]. CHINESE JOURNAL OF PARASITOLOGY AND PARASITIC DISEASES, 2023, 41(5): 539-545. |
| [3] | YUAN Huizhen, LI Dongliang, CHENG Shuqi, JIAN Fuchun. Study on the characteristics of Blastocystis cultured in vitro [J]. CHINESE JOURNAL OF PARASITOLOGY AND PARASITIC DISEASES, 2023, 41(5): 631-635. |
| [4] | NI Bixian, XU Xiangzhen, ZHANG Qiang, TANG Feng, ZHANG Jiayao, MAO Fanzhen, DAI Yang, LIU Yaobao, CAO Jun. Epidemiological characteristics of echinococcosis cases reported in the National Notifiable Disease Report System in Jiangsu Province, 2015—2022 [J]. CHINESE JOURNAL OF PARASITOLOGY AND PARASITIC DISEASES, 2023, 41(5): 636-639. |
| [5] | LIU Wenhu, HUANG Ming, LIANG Jin, LIU Jianxiong, WEN Zhaomeng, MA Shaobo. A case of ventricular cysticercosis complicated with hydrocephalus [J]. CHINESE JOURNAL OF PARASITOLOGY AND PARASITIC DISEASES, 2023, 41(5): 644-646. |
| [6] | ZHANG Li, MIAO Feng, SHEN Yanmei. A case of Capillaria hepatica infection [J]. CHINESE JOURNAL OF PARASITOLOGY AND PARASITIC DISEASES, 2023, 41(5): 650-652. |
| [7] | LI Xiaoli, LI Shaogang, WU Zhaoyong. Clinical characteristics of patients with intestinal Diphyllobothrium tapeworm infection [J]. CHINESE JOURNAL OF PARASITOLOGY AND PARASITIC DISEASES, 2023, 41(4): 459-463. |
| [8] | ZHANG Juan, TAO Hong, LI Yanzhong, WANG Tingting, YANG Jingjing, XIANG Yibin, CHEN Yishan, ZHOU Xiaomei. Survey on Angiostrongylus cantonensis infection in common snails in Yunnan Province from 2017 to 2022 [J]. CHINESE JOURNAL OF PARASITOLOGY AND PARASITIC DISEASES, 2023, 41(4): 464-469. |
| [9] | ZHENG Yuhua, TIE Ping, BAI Yongfei, YAN Changfu, WANG Ting, WANG Jingying, TIAN Xiaodong, DAI Peifang. Investigation on visceral leishmaniasis in domestic dogs and sandfly density in epidemic area in Shanxi Province from 2021 to 2022 [J]. CHINESE JOURNAL OF PARASITOLOGY AND PARASITIC DISEASES, 2023, 41(4): 470-475. |
| [10] | LI Yuqiong, YU Youli, GAO Junrong, LIU Yunyun, LI Hongbing, NIU Xiaohao. Enterocytozoon bieneusi infection in dairy cows and its genotype identification in Yinchuan area of Ningxia Province [J]. CHINESE JOURNAL OF PARASITOLOGY AND PARASITIC DISEASES, 2023, 41(4): 476-479. |
| [11] | WEI Luanting, LI Runze, GUAN Liangchao, ZHANG Qianyu, LI Cheng, CAO Yaming, ZHAO Yan. Research progress of antimalarial drugs [J]. CHINESE JOURNAL OF PARASITOLOGY AND PARASITIC DISEASES, 2023, 41(4): 486-491. |
| [12] | LAN Weiming, XU Hui, XU Yin, QIU Tingting, XIE Shuying, DENG Fenglin, HU Shaoliang, LIU Huan, GUO Jiagang, ZENG Xiaojun. Study on early warning of high risk environment of Schistosoma japonicum infection by quantitative real-time PCR [J]. CHINESE JOURNAL OF PARASITOLOGY AND PARASITIC DISEASES, 2023, 41(4): 502-505. |
| [13] | WANG Feng, WU Fan, LI Linlin, HUANG Qingqing. Prevalence of parasitic infections in wild mice in Wuhu City, Anhui Province [J]. CHINESE JOURNAL OF PARASITOLOGY AND PARASITIC DISEASES, 2023, 41(4): 516-519. |
| [14] | ZHU Canmin, PENG Weijian, WANG Dili, ZHOU Huajing, JIN Qiangjian, CHANG Chang. A case of acute primary amoebic meningoencephalitis [J]. CHINESE JOURNAL OF PARASITOLOGY AND PARASITIC DISEASES, 2023, 41(4): 524-526. |
| [15] | CHAO Anqi, LI Huimin, HU Qinqin, ZHOU Xiaonong, GUO Xiaokui, YIN Kun. The control strategies for zoonoses under climate change based on the One Health concept [J]. CHINESE JOURNAL OF PARASITOLOGY AND PARASITIC DISEASES, 2023, 41(3): 263-269. |
| Viewed | ||||||
|
Full text |
|
|||||
|
Abstract |
|
|||||