中国寄生虫学与寄生虫病杂志 ›› 2023, Vol. 41 ›› Issue (5): 559-566.doi: 10.12140/j.issn.1000-7423.2023.05.006

• 论著 • 上一篇    下一篇

细粒棘球蚴感染诱导巨噬细胞表达CD73和A2AR抑制炎症反应

逯君霞1(), 许军英1, 赵彬1, 王芊文1, 李文华1, 耿玉庆1, 侯隽1, 吴向未1,2, 陈雪玲1,*()   

  1. 1 石河子大学医学院,新疆石河子 832000
    2 石河子大学医学院第一附属医院,新疆石河子 832008
  • 收稿日期:2023-04-26 修回日期:2023-09-09 出版日期:2023-10-30 发布日期:2023-11-06
  • 通讯作者: *陈雪玲(1971-),女,博士,教授,从事感染与免疫研究。E-mail:chenxueling@shzu.edu.cn
  • 作者简介:逯君霞(1995-),女,硕士研究生,从事感染与免疫研究。E-mail:1770063991@qq.com
  • 基金资助:
    国家自然科学基金(82060297);兵团指导性科技计划(2022ZD041);自治区研究生科研创新项目(XJ2022G111);兵团财政科技计划(2021BB006)

Echinococcus granulosus infection induces macrophages to express CD73 and A2AR to suppress inflammatory response

LU Junxia1(), XU Junying1, ZHAO Bin1, WANG Qianwen1, LI Wenhua1, GENG Yuqing1, HOU Jun1, WU Xiangwei1,2, CHEN Xueling1,*()   

  1. 1 School of Medicine, Shihezi University, Shihezi 832000, Xinjiang, China
    2 The First Affiliated Hospital, School of Medicine, Shihezi University, Shihezi 832008, Xinjiang, China
  • Received:2023-04-26 Revised:2023-09-09 Online:2023-10-30 Published:2023-11-06
  • Contact: *E-mail: chenxueling@shzu.edu.cn
  • Supported by:
    National Natural Science Foundation Project(82060297);Bingtuan guiding Science and Technology Plan Project(2022ZD041);Scientific Research and Innovation Project for Graduate Students in the Autonomous Region(XJ2022G111);Bingtuan Financial Science and Technology Plan Project(2021BB006)

摘要:

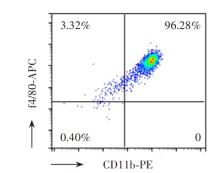
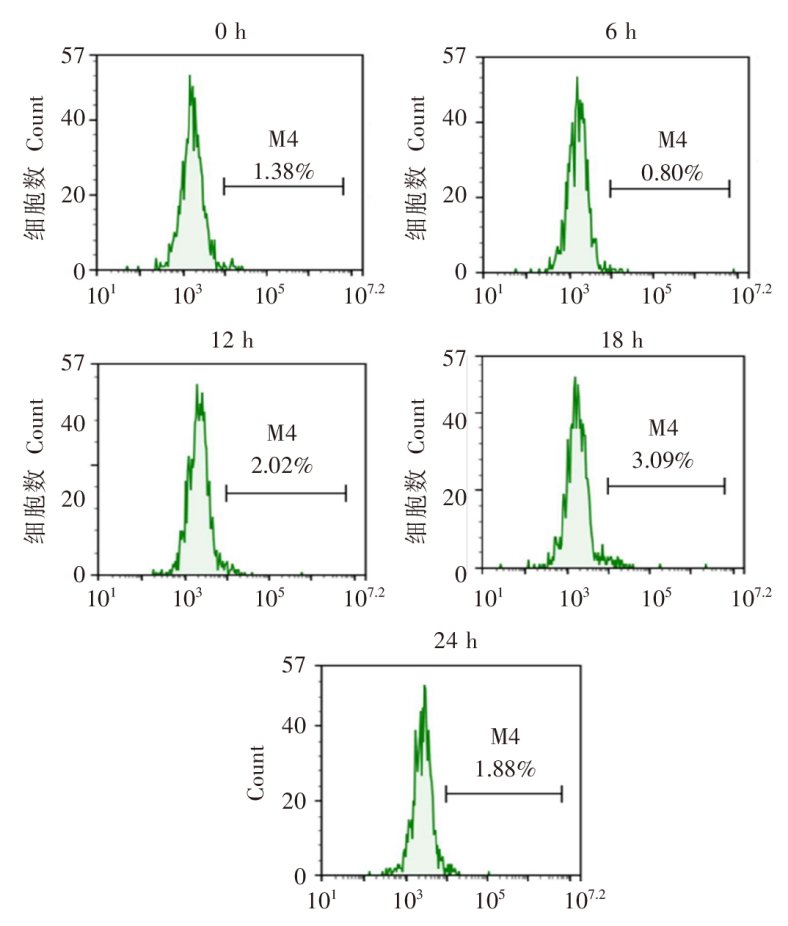
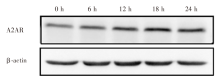
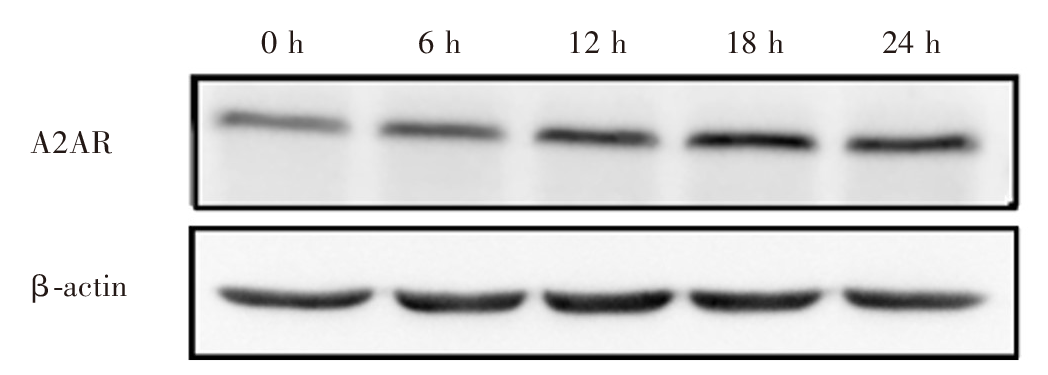
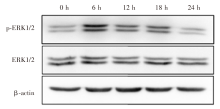
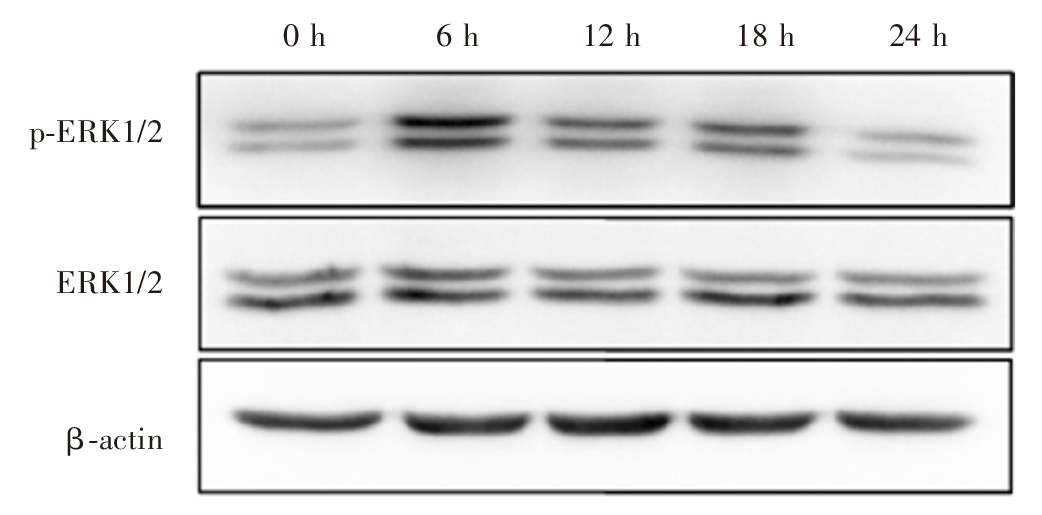
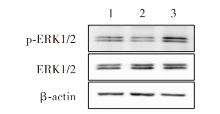
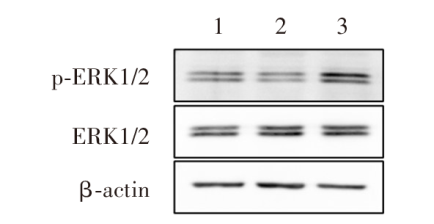
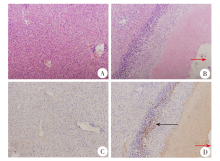
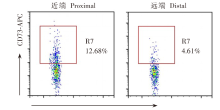
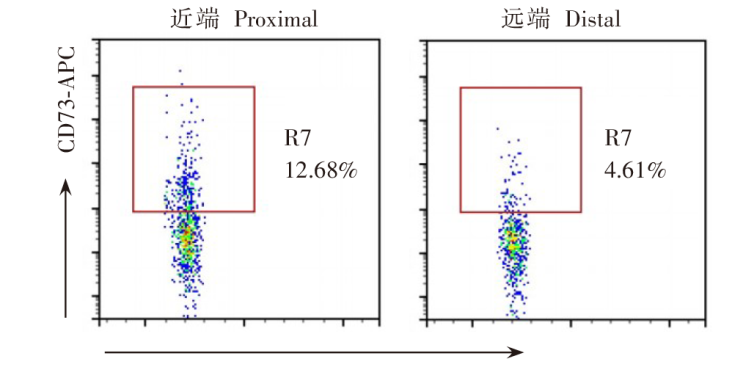
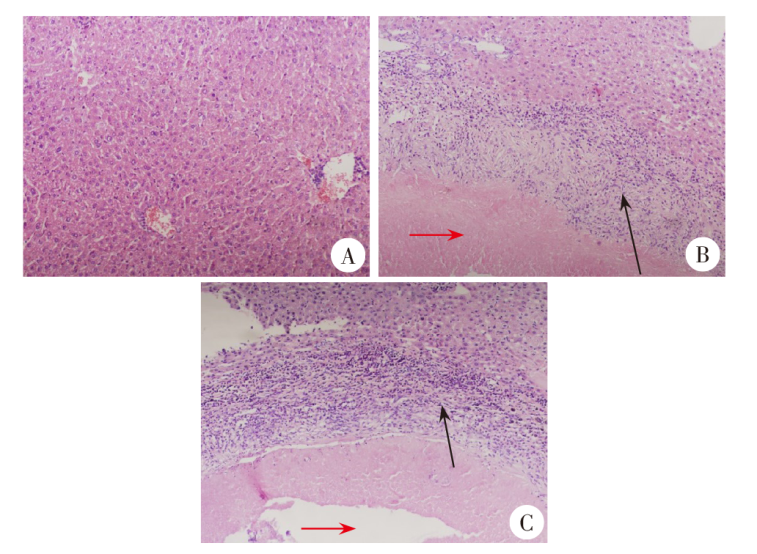
目的 探究CD73/腺苷/腺苷A2A受体(A2AR)通路在细粒棘球蚴抑制巨噬细胞炎症反应中的作用及机制。 方法 取健康C57BL/6小鼠腹腔注射无菌淀粉肉汤(0.5 ml/只),3 d后抽取腹腔液,分离巨噬细胞,以1 × 10⁶/ml接种于6孔板中,待细胞贴壁后,加入细粒棘球蚴囊液(终浓度0.8 mg/ml)培养0、6、12、18和24 h后,qRT-PCR检测CD73、A2AR、肿瘤坏死因子α(TNF-α)和精氨酸酶1(Arg-1)的相对转录水平,流式细胞术检测CD73的表达量,蛋白质免疫印迹(Western blotting)检测A2AR、细胞外信号调节激酶1/2(ERK1/2)和磷酸化的ERK1/2(p-ERK1/2)的表达量。取分离的巨噬细胞接种于6孔板(1 × 106个细胞/孔),囊液组、给药组和对照组(每组3孔)分别加入囊液(终浓度0.8 mg/ml)、囊液(终浓度0.8 mg/ml)和药物(腺苷受体抑制剂SCH58261,终浓度50 μmol/L),以及等量培养基,培养24 h后,采用qRT-PCR检测TNF-α、Arg-1的相对转录水平,Western blotting检测ERK1/2、p-ERK1/2的表达量。取6~8周龄健康C57BL/6雌鼠,感染组小鼠于肝被膜下注射5 000个细粒棘球蚴原头节(20 μl/只),健康组小鼠不作处理。1个月后,两组各取6只小鼠,取肝脏,石蜡包埋后制备切片,HE染色观察肝组织病变情况,免疫组织化学染色检测A2AR的表达情况,流式细胞术检测包囊近端和远端肝组织的CD73表达情况。取感染小鼠,给药组(8只)和溶剂组(8只)小鼠分别腹腔注射腺苷受体抑制剂(SCH58261)1 mg/(kg•d)和等量的PBS,健康组小鼠(8只)不作处理,22 d后,称量小鼠的体质量,以及肝脏、脾脏、肾脏和心脏的质量,计算各脏器与体质量的比值;取小鼠肝组织,石蜡包埋后制备切片,HE染色观察包囊周围炎性细胞浸润情况。两组间数据比较采用独立样本t检验,多组间数据比较采用单因素方差分析。 结果 巨噬细胞经细粒棘球蚴囊液处理后,CD73 mRNA相对转录水平,18 h组(1.66 ± 0.17)和24 h组(2.01 ± 0.15)均高于0 h组(1.00 ± 0.09)(t = 3.35,P < 0.05;t = 5.83,P < 0.01);流式细胞术检测结果显示,CD73+巨噬细胞占比,18 h组[(2.74 ± 0.43)%],高于0 h组[(1.53 ± 0.10)%](t = 4.72,P < 0.01)。6、12、18、24 h组A2AR mRNA的相对转录水平分别为1.00 ± 0.14、1.02 ± 0.02、0.72 ± 0.08、1.03 ± 0.03,均高于0 h组(0.29 ± 0.03)(t = 4.84、17.55、5.21、15.26,均P < 0.01);Western blotting结果显示,6、12、18、24 h组A2AR蛋白相对表达量分别为1.22 ± 0.05、1.32 ± 0.02、1.40 ± 0.05、1.46 ± 0.04,均高于0 h组(1.00 ± 0.00)(t = 5.89、18.35、9.14、15.06,均P < 0.01)。TNF-α mRNA的相对转录水平,6、12和18 h组分别为1.00 ± 0.04、0.31 ± 0.03、0.12 ± 0.01,均高于0 h组(0.01 ± 0.00)(t = 22.37、11.33、11.48,均P < 0.01)。Arg-1 mRNA的相对转录水平,18 h组(0.69 ± 0.09)和24 h组(2.10 ± 0.07)均高于0 h组(0.004 ± 0.00)(t = 7.61、28.64,均P < 0.01)。Western blotting结果显示,6、12、18 h组p-ERK1/2蛋白的相对表达量分别为3.07 ± 0.71、1.68 ± 0.18、1.43 ± 0.14,均高于0 h组(1.00 ± 0.00)(t = 4.15、5.40、4.50,均P < 0.05),且6 h组高于18 h组和24 h组(0.97 ± 0.34)(t = 3.23、3.80,均P < 0.05)。囊液组和给药组TNF-α mRNA的相对转录水平分别为0.85 ± 0.05和1.56 ± 0.13(t = 5.13,P < 0.01);囊液组Arg-1 mRNA的相对转录水平为147.73 ± 10.06,高于给药组(13.94 ± 1.00)和对照组(59.59 ± 9.82)(t = 13.23、6.27,均P < 0.01),且给药组的相对转录水平低于对照组(t = 4.62,P < 0.01);Western blotting结果显示,给药组p-ERK1/2的蛋白相对表达量(2.08 ± 0.38)高于囊液组(0.94 ± 0.29)和对照组(1.00 ± 0.00)(t = 3.42、4.04,均P < 0.05)。HE染色结果显示,感染组小鼠肝组织出现炎性细胞浸润带;免疫组织化学染色结果显示,感染组小鼠肝组织炎症细胞A2AR阳性。流式细胞术检测结果显示,包囊近端肝组织CD73+巨噬细胞占比为(12.31 ± 0.04)%,高于远端的(5.95 ± 2.36)%(t = 3.81,P < 0.05)。药物处理22 d后,健康组、溶剂组和给药组的小鼠肝脏、脾脏、肾脏、心脏的质量与体质量的比值分别为6.13 ± 0.66、5.90 ± 0.48、5.47 ± 0.87,0.44 ± 0.18、0.41 ± 0.29、0.33 ± 0.10,0.68 ± 0.03、0.64 ± 0.05、0.60 ± 0.09,0.99 ± 0.15、0.77 ± 0.13、0.78 ± 0.19,差异无统计学意义(F = 0.95、0.42、1.46、2.02,均P > 0.05)。HE染色结果显示,与溶剂组相比,给药组包囊周围炎性细胞增多。 结论 细粒棘球蚴通过诱导巨噬细胞表达CD73和A2AR促进炎症抑制因子的分泌来逃避宿主免疫。

关键词: 细粒棘球蚴, 巨噬细胞, CD73, 腺苷A2A受体

Abstract:

Objective To investigate the role and mechanisms of CD73/adenosine/adenosine A2A receptor (A2AR) pathway in suppression of macrophage inflammatory response of Echinococcus granulosus. Methods Healthy C57BL/6 mice were intraperitoneally injected with aseptic starch broth (0.5 ml per mouse). Ascitic fluid was extracted from the mice on 3 d post-injection to separate macrophages, which were inoculated into a 6-well plate at a dose of 1 × 10⁶/ml. After the cells were attached to the plate wall, E. granulosus cyst fluid was added at a final concentration of 0.8 mg/ml, and then cultured for 0 h, 6 h, 12 h, 18 h and 24 h to examine the relative transcriptional levels of CD73, A2AR, tumor necrosis factor-α (TNF-α) and arginase 1 (Arg-1) by qRT-PCR. The expression of CD73 was detected by flow cytometry, and the expression of extracellular signal-regulated kinase 1 (ERK1/2) and phosphorylated ERK1/2 (p-ERK1/2) was detected by Western blotting. The separated macrophages were inoculated onto a 6-well plate with 1 × 10⁶ cells per well, and assigned to three groups: cyst fluid group, drug administration group and control group. Each group had 3 wells, to which E. granulosus cyst fluid (final concentration 0.8 mg/ml), E. granulosus cyst fluid (final concentration 0.8 mg/ml) and drugs (adenosine receptor inhibitor SCH58261, final concentration 50 μmol/L) and the same amount of medium was added, respectively. After 24 hours of culture, the relative transcription levels of TNF-α and Arg-1 were detected by qRT-PCR. The expression of ERK1/2 and p-ERK1/2 was detected by Western blotting. Thirty-six healthy C57BL/6 female mice aged 6-8 weeks were selected. 5 000 protoscolex of E. granulosus (20 μl per mouse) were injected under the liver capsule in the infection group, and the healthy group were not treated. One month later, the livers of 6 mice in each group were selected and embedded in paraffin to prepare slices. HE staining was used to observe liver tissue lesions, and the expression of A2AR was detected by immunohistochemical staining. The expression of CD73 in the proximal and distal vesicles was detected by flow cytometry. Infected mice were taken, and 1 mg/(kg•d) adenosine receptor inhibitor (SCH58261) and an equivalent amount of PBS were intraperitoneally injected into the treatment group (8 mice) and solvent group (8 mice), respectively. Healthy mice (8 mice) were not treated. After 22 days, the mice’s weight, liver, spleen, kidney and heart were weighed, and the ratio of each organ to body weight was calculated. After the mouse liver was embedded in paraffin, the sections were prepared, and the infiltration of inflammatory cells around the vesicles was observed by HE staining. Results The relative transcription level of CD73 mRNA in 18 h group (1.66 ± 0.17) and 24 h group (2.01 ± 0.15) was higher than that in 0 h group (1.00 ± 0.09) after 0 h, 6 h, 12 h, 18 h and 24 h treatment of macrophages with E. granulosus cyst solution (t = 3.35, P < 0.05; t = 5.83, P < 0.01). Flow cytometry showed that the percentage of CD73+ macrophages in 18 h group was (2.74 ± 0.43)%, which was higher than that in 0 h group (1.53 ± 0.10)% (t = 4.72, P < 0.01). The relative transcription levels of A2AR mRNA were 0.29 ± 0.03, 1.00 ± 0.14, 1.02 ± 0.02, 0.72 ± 0.08, 1.03 ± 0.03, respectively. All groups at 6 h, 12 h, 18 h and 24 h were higher than those in 0 h group (t = 4.84, 17.55, 5.21, 15.26; all P < 0.01). The western blotting results showed that the relative expression levels of A2AR protein in each group were 1.00 ± 0.00, 1.22 ± 0.05, 1.32 ± 0.02, 1.40 ± 0.05, and 1.46 ± 0.04, respectively. The relative expression levels of other groups were higher (t = 5.89, 18.35, 9.14, 15.06; all P < 0.01). Western blotting showed that the relative expression levels of A2AR protein in 6, 12, 18 and 24 h groups were 1.22 ± 0.05, 1.32 ± 0.02, 1.40 ± 0.05, and 1.46 ± 0.04,0.04, respectively. All of them were higher than those in the 0 h group (1.00 ± 0.00) (t = 5.89, 18.35, 9.14, 15.06; all P < 0.01). The relative transcription levels of TNF-α mRNA in the 6, 12 and 18 h groups were 1.00 ± 0.04, 0.31 ± 0.03, 0.12 ± 0.01, 0.05 ± 0.01, respectively, which were higher than those in the 0 h group (0.01 ± 0.00) (t = 22.37, 11.33, 11.48; all P < 0.01). The relative transcription level of Arg-1 mRNA in 18 h group (0.69 ± 0.09) and 24 h group (2.10 ± 0.07) was higher than that in 0 h group (0.004 ± 0.00) (t = 7.61, 28.64; both P < 0.01). Western blotting results showed that the relative expression of p-ERK1/2 protein in the 6 h group (3.07 ± 0.71), 12 h group (1.68 ± 0.18) and 18 h group (1.43 ± 0.14) was higher than that in the 0 h group (1.00 ± 0.00) (t = 4.15, 5.40, 4.50; all P < 0.05). The 6 h group was higher than the 18 h and 24 h groups (0.97 ± 0.34) (t = 3.23, 3.80; both P < 0.05). The relative transcription levels of TNF-α mRNA were 0.85 ± 0.05 and 1.56 ± 0.13 in the capsule fluid group and administration group, respectively, and the difference was statistically significant (t = 5.13, P < 0.01). The relative transcription level of Arg-1 mRNA in the capsule fluid group was 147.73 ± 10.06, which was higher than that in the drug administration group (13.94 ± 1.00) (t = 13.23, P < 0.01) and control group (59.59 ± 9.82) (t = 6.27, P < 0.01). The relative transcription level in the administration group was lower than that in the control group, and the difference was statistically significant (t = 4.62, P < 0.01). Western blotting results showed that the relative protein expression of P-ERK1/2 in the administration group (2.08 ± 0.38) was higher than that in the capsule fluid group (0.94 ± 0.29) and control group (1.00 ± 0.00) (t = 3.42, 4.04; both P < 0.05). The HE staining showed that inflammatory cell infiltration zones appeared in the liver tissue of infected mice. The immunohistochemical staining results showed that A2AR was positive in the infection group. The results of flow cytometry showed that the percentage of macrophages with CD73+ in the proximal vesicle was (12.31 ± 0.04)%, which was higher than that at the distal vesicle (5.95 ± 2.36)% (t = 3.81, P < 0.05). After administration, the ratio of weight of liver, spleen, kidney and heart to body mass in the healthy group, solvent group and administration group was 6.13 ± 0.66, 5.90 ± 0.48, 5.47 ± 0.87, 0.44 ± 0.18, 0.41 ± 0.29, 0.33 ± 0.10. There was no significant difference between 0.68 ± 0.03, 0.64 ± 0.05, 0.60 ± 0.09, 0.99 ± 0.15, 0.77 ± 0.13, 0.78 ± 0.19 (F = 0.95, 0.42, 1.46, 2.02; all P > 0.05). HE staining showed that perivascular inflammatory cells increased in the drug administration group compared with the solvent group. Conclusion E. granulosus evades host immunity by inducing macrophages to express CD73 and A2AR and thereby promoting the secretion of its inflammatory inhibitory factors.

Key words: Echinococcus granulosus, Macrophages, CD73, Adenosine A2A receptor

中图分类号: