中国寄生虫学与寄生虫病杂志 ›› 2023, Vol. 41 ›› Issue (5): 539-545.doi: 10.12140/j.issn.1000-7423.2023.05.003

• 论著 • 上一篇    下一篇

鼠疟原虫感染大鼠和小鼠的种特异性分析

郭帅(), 何彪, 高源利, 范永铃, 朱锋, 丁艳, 刘太平, 徐文岳*()   

  1. 陆军军医大学基础医学院病原生物学教研室,重庆 400038
  • 收稿日期:2023-04-26 修回日期:2023-06-30 出版日期:2023-10-30 发布日期:2023-11-06
  • 通讯作者: *徐文岳(1972-),男,博士,教授,从事疟疾感染免疫研究。E-mail:xuwenyue@tmmu.edu.cn
  • 作者简介:郭帅(1990-),男,硕士研究生,从事疟疾感染免疫研究。E-mail:guoshuai@tmmu.edu.cn
  • 基金资助:
    国家自然科学基金面上项目(82172296)

Specie-specific analysis of plasmodia infecting rats and mice

GUO Shuai(), HE Biao, GAO Yuanli, FAN Yongling, ZHU Feng, DING Yan, LIU Taiping, XU Wenyue*()   

  1. Department of Pathogenic Biology, Army Medical University, Chongqing 400038, China
  • Received:2023-04-26 Revised:2023-06-30 Online:2023-10-30 Published:2023-11-06
  • Contact: *E-mail: xuwenyue@tmmu.edu.cn
  • Supported by:
    General Program of National Natural Science Foundation of China(82172296)

摘要:

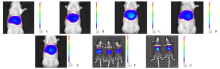
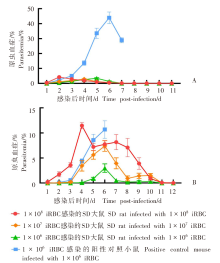
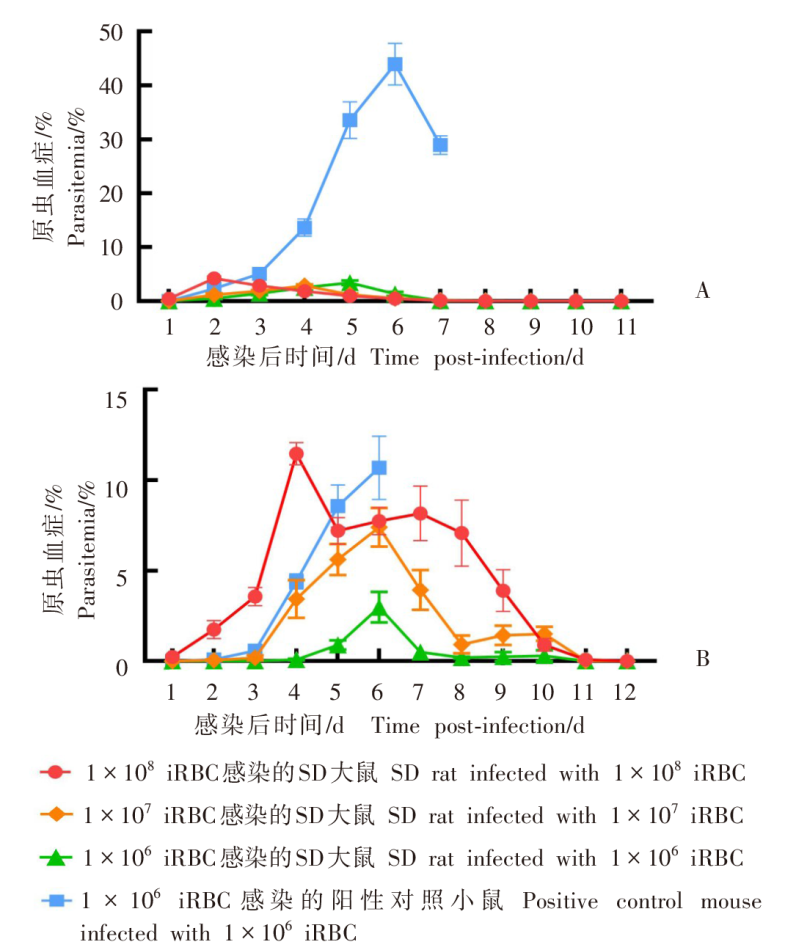
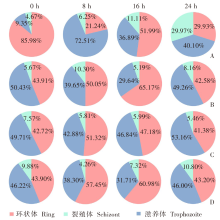
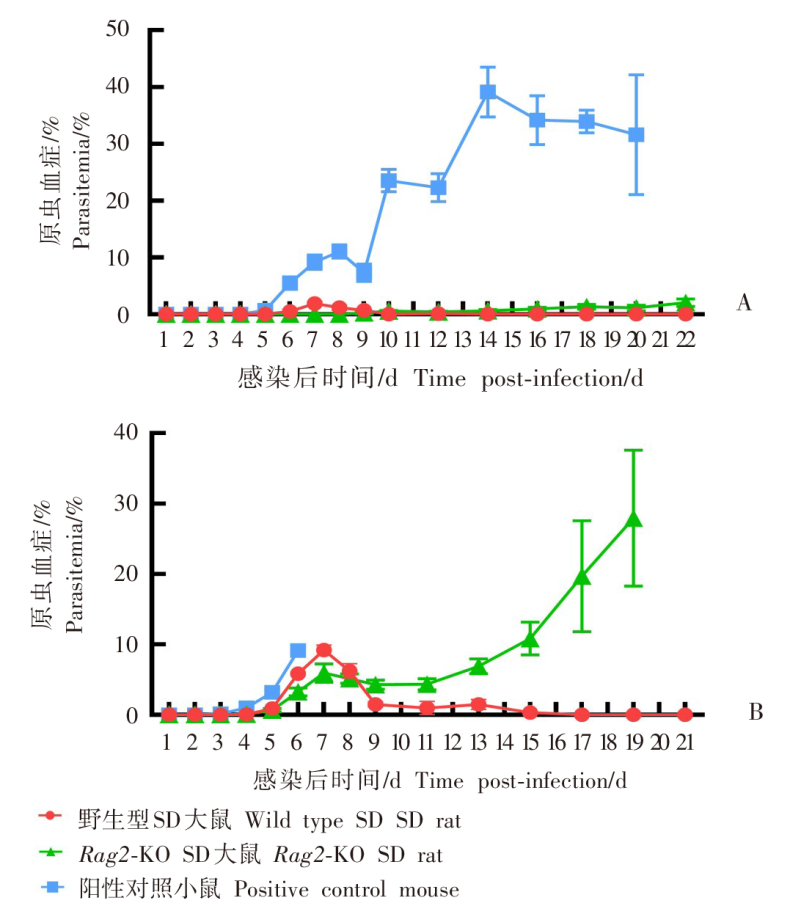
目的 用约氏疟原虫(P.y)BY265株和伯氏疟原虫(P.b)ANKA-luciferase株感染小鼠和大鼠,分析鼠疟原虫感染宿主的种特异性。 方法 制备P.yP.b的子孢子和裂殖子。分别用5 × 10⁴P.yP.b子孢子经尾静脉注射感染SD大鼠、BALB/c小鼠(P.y感染组,5只/组)和SD大鼠、C57BL/6J小鼠(P.b感染组,5只/组),每日取尾静脉血涂片镜检,记录红内期疟原虫出现的时间。P.y子孢子感染SD大鼠和BALB/c小鼠后42 h取肝组织,实时荧光定量PCR(qRT-PCR)检测肝组织疟原虫18S rRNA的相对表达量。P.b子孢子感染SD大鼠和C57BL/6J小鼠后42 h活体成像法检测肝脏荧光值。分别用1 × 10⁸、1 × 10⁷、1 × 10⁶P.yP.b被感染红细胞(iRBC)感染SD大鼠(P.y感染组、P.b感染组)和易感小鼠(BALB/c、C57BL/6J)(阳性对照组),每日取尾静脉血涂片镜检,计算原虫血症。分别用P.yP.b裂殖子感染SD大鼠和易感小鼠,每日取尾静脉血涂片镜检,计算原虫血症;当大鼠、小鼠原虫血症达到峰值后,每隔8小时取尾静脉血涂片镜检,持续24 h,分析疟原虫发育节律;观察大鼠、小鼠实验性脑型疟(ECM)的发生情况。分别用P.yP.b裂殖子感染T、B细胞缺陷的Rag2-KO SD大鼠、野生型SD大鼠和易感小鼠,每日取尾静脉血涂片观察,计算原虫血症。两组数据之间比较采用非配对t检验,组间原虫血症趋势比较采用双因素方差分析(two-way ANOVA)。 结果 P.y感染组的SD大鼠、BALB/c小鼠,P.b感染组的SD大鼠、C57BL/6J小鼠体内疟原虫均能完成肝期发育,于第3天进入红内期。qRT-PCR结果显示,P.y子孢子感染SD大鼠、BALB/c小鼠体内疟原虫特异性18S rRNA相对表达量分别为(1.63 ± 0.381)、(1.00 ± 0.232),二者差异有统计学意义(t = 2.801,P < 0.05)。活体成像结果显示,P.b子孢子感染SD大鼠体内荧光度值为(6.243 ± 1.425)× 107,高于C57BL/6J小鼠的(1.624 ± 0.530)× 107t = 6.077,P < 0.01)。红内期iRBC感染结果显示,3种剂量的P.y感染组SD大鼠的原虫血症趋势[峰值分别为(3.500 ± 1.042)%、(2.850 ± 0.627)%、(3.400 ± 0.962)%]之间差异无统计学意义(F = 0.145,P > 0.05),但与阳性对照组[峰值为(43.928 ± 9.448%)]差异有统计学意义(F = 84.040、63.760、58.400,均P < 0.01);P.b感染组SD大鼠的原虫血症趋势[峰值分别为(11.468 ± 1.362)%、(7.398 ± 2.387)%、(2.984 ± 1.881)%]随感染剂量降低而下降,其中1 × 10⁸、1 × 10⁶剂量组原虫血症趋势与阳性对照组[峰值为(10.682 ± 4.278)%]差异有统计学意义(F = 13.83、17.320,均P < 0.01),1 × 107剂量组原虫血症趋势与阳性对照组差异无统计学意义(F = 2.234,P > 0.05)。裂殖子感染结果显示,感染后6 d,P.y感染组SD大鼠、BALB/c小鼠原虫血症分别为(0.902 ± 0.235)%、(17.420 ± 4.105)%,二者差异有统计学意义(t = 9.943,P < 0.01);P.b感染组SD大鼠、C57BL/6J小鼠原虫血症分别为(6.804 ± 2.978)%、(9.290 ± 1.055)%,二者差异无统计学意义(t = 1.759,P > 0.05);P.b感染组SD大鼠、C57BL/6J小鼠ECM累计发生率分别为11/15、13/15,二者差异无统计学意义(t = 1.414,P > 0.05)。发育节律分析结果显示,P.y感染组SD大鼠发育节律与BALB/c小鼠不同,未呈现24 h规律;P.b感染组SD大鼠发育节律与C57BL/6J小鼠相近,具有24 h规律。感染后18 d,P.y感染组Rag2-KO SD大鼠、野生型SD大鼠、BALB/c小鼠原虫血症分别为(1.326 ± 0.908)%、0、(33.937 ± 3.453)%,Rag2-KO SD大鼠与野生型SD大鼠之间原虫血症差异有统计学意义(t = 2.267,P < 0.05);感染后17 d,P.b感染组Rag2-KO SD大鼠、野生型SD大鼠的原虫血症为(19.685 ± 5.752)%、(0.007 ± 0.013)%(t = 2.499,P < 0.05),阳性对照组仅存的1只C57BL/6J小鼠的原虫血症为25.410%。 结论 P.yP.b子孢子均能感染大鼠并完成肝期发育进入红内期。鼠疟原虫不易感染大鼠的影响因素在红内期,大鼠体内鼠疟原虫可被清除;P.y对宿主种属表现出更强的选择性;P.b感染大鼠的急性期原虫血症和ECM发生率与小鼠差异均无统计学意义。适应性免疫在大鼠彻底清除体内鼠疟原虫中发挥重要作用。

关键词: 约氏疟原虫, 伯氏疟原虫, 肝期, 红内期, 感染

Abstract:

Objective To analyze the infection specie-specificity of Plasmodium yoelii (P.y) BY265 strain and P. berghei (P.b) ANKA-luciferase strain in rats and mice. Methods The sporozoites and merozoites of P.y and P.b were prepared. Infection was performed by injecting 1 × 10⁵ P.y and P.b sporozoites to SD rats and BALB/c mice (P.y infection, 5 SD rats/group, 5 BALB/c mice/group) and SD rats, C57BL/6J mice (P.b infection, 5 SD rats/group, 5 C57BL/6J mice/group) through tail vein, respectively. The tail vein blood samples were collected daily to prepare blood mears for microscopic examination to record the appearance time of erythrosytic stage of Plasmodium. Liver tissue samples were collected at 42 h post‑infection from the SD rats and BALB/c mice of P.y infection group to examine the relative expression level of Plasmodium 18S rRNA by real‑time quantitative PCR (qRT‑PCR), and measure the liver fluorescence signal in SD rats and C57BL/6J mice in P.b infection groups using IVIS Lumina imaging system. A dose of 1 × 10⁸, 1 × 10⁷, 1 × 10⁶ infected red blood cells (iRBCs) of P.y and P.b was used to infect SD rats (P.y infection group and P.b infection group) and susceptible mice (BALB/c and C57BL/6J) (positive control group), the tail vein blood was collected daily for smear to exam the parasitemia. The SD rats and susceptible mice were infected with P.y and P.b merozoites, respectively. The tail vein blood was collected daily for microscopic examination to calculate the parasitemia. When the parasitemia in rats and mice reached its peak, the tail vein blood smears were prepared every 8 hours for 24 hours for microscopic examination, and the proportions of rings, trophozoites, and schizonts were calculated to analyze the developmental rhythm of the rodent Plasmodium. The experimental cerebral malaria (ECM) in rats and mice were recorded. Rag2-KO SD rats, wild‑type SD rats, and susceptible mice were infected with P.y and P.b merozoites respectively, the tail vein blood smears were examined daily to calculate parasitemia. The comparison between the two groups was performed by unpaired t‑test, and the comparison between different groups of parasitemia performed by two‑way analysis of variance (two‑way ANOVA). Results All Plasmodium in the SD rats, BALB/c mice and C57BL/6J mice infected with P.y and P.b sporozoites completed the liver stage development and entered the erythrocytic stage on day 3. The qRT-PCR results showed that the relative expression levels of Plasmodium-specific 18S rRNA in SD rats and BALB/c mice infected with P.y sporozoites were (1.63 ± 0.381) and (1.00 ± 0.232) with statistically significant difference (t = 2.801, P < 0.05). The results of IVIS imaging showed that the total fluorescence intensity of SD rats infected with P.b sporozoites was (6.243 ± 1.425) × 107, which was significantly higher than that of C57BL/6J mice [(1.624 ± 0.530) × 107] (t = 6.077, P < 0.01). The results of erythrocyte stage iRBCs infection showed that in P.y infected groups, the peaks of parasitemia of SD rats infected with three doses were (3.500 ± 1.042)%, (2.850 ± 0.627)%, (3.400 ± 0.962)%, there was no significant difference in the trends of parasitemia among them (F = 0.145, P > 0.05), but there were significant differences in the trends of parasitemia between each group of rats and the positive control [the peak of parasitemia was (43.928 ± 9.448) %)](F = 84.040, 63.760, 58.400; all P < 0.01). In P.b infected groups, the peaks of parasitemia of SD rats were (11.468 ± 1.362)%, (7.398 ± 2.387)%, (2.984 ± 1.881)% which decreased along with infection dose decent, and the trends of parasitemia in the 1 × 10⁸ and 1 × 10⁶ dose infected rat groups was significantly different from that in the positive control (F = 13.83, 17.320; all P < 0.01), while the difference in trends of parasitemia between 1 × 10⁸ dose infected rat group and the positive control group was not significant (F = 2.234, P > 0.05). The results of merozoite infection showed that 6 days after infection, the parasitemia of SD rats and BALB/c mice in P.y infected groups were (0.902 ± 0.235)% and (17.420 ± 4.105)% respectively, which were significant different (t = 9.943, P < 0.01). The parasitemia of SD rats and C57BL/6J mice in P.b infected groups were (6.804 ± 2.978)%, (9.290 ± 1.055)% respectively, and there was no significant difference between the two groups (t = 1.759, P > 0.05). The cumulative incidences of ECM in SD rats and C57BL/6J mice in P.b infected groups were 11/15 and 13/15 respectively, with no statistically significant difference (t = 1.414, P > 0.05). The developmental rhythm analysis results showed that the developmental rhythm of SD rats was different from that of BALB/c mice, and did not exhibit a 24-hour pattern in P.y infected groups. While in P.b infected groups, the developmental rhythm of SD rats was similar to that of C57BL/6J mice, with a 24-hour rhythm. 18 days post-infection with P.y merozoites, the parasitemia in Rag2-KO SD rats, WT SD rats, and BALB/c mice with were (1.326 ± 0.908)%, 0, and (33.937 ± 3.453)% respectively, there was a significant difference of parasitemia between Rag2-KO SD rats and WT SD rats (t = 2.267, P < 0.05). Seventeen days post-infection with P.b merozoites, the parasitemia in Rag2-KO SD rats and WT SD rats were (19.685 ± 15.752)%, (0.007 ± 0.013)% (t = 2.499, P < 0.05), and parasitemia of the remaining one C57BL/6J mouse in the positive control group was 25.410%. Conclusion Sporozoites of P.y and P.b can infect rats, complete their liver stage development and enter the erythrocytic stage. The influencing factor leading to the rats resistant to P.y and P.b infection occurs at the erythrocytic stage, when the rodent Plasmodium in the rats could be cleared. P.y exhibits stronger selectivity for host species. There were no significant differences between rats and mice in P.b parasitemia at acute pahase and the occurring rate of ECM. Adaptive immunity plays an important role in complete clearance of rodent plasmodium in rats.

Key words: Plasmodium yoelii, Plasmodium berghei, Liver stage, Erythrocytic stage, Infection

中图分类号: