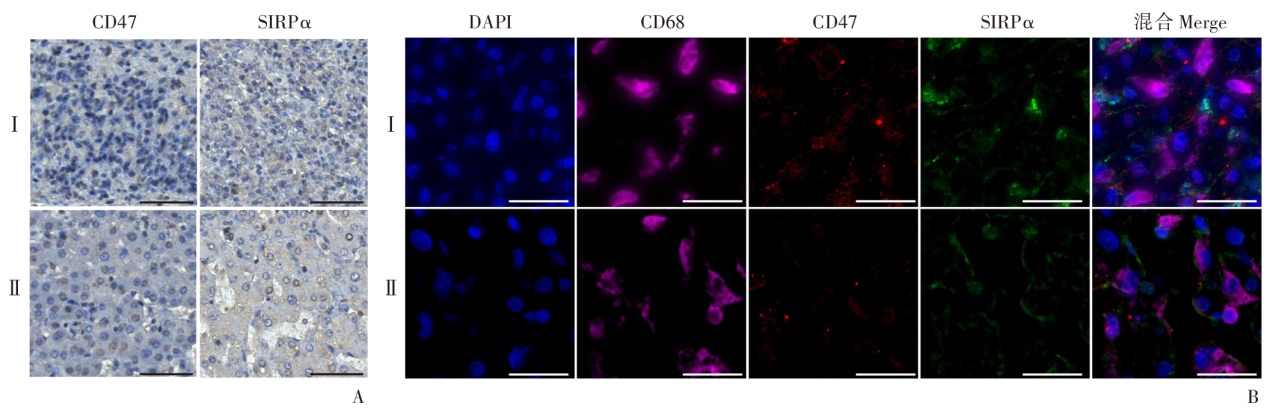
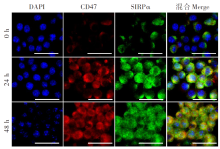
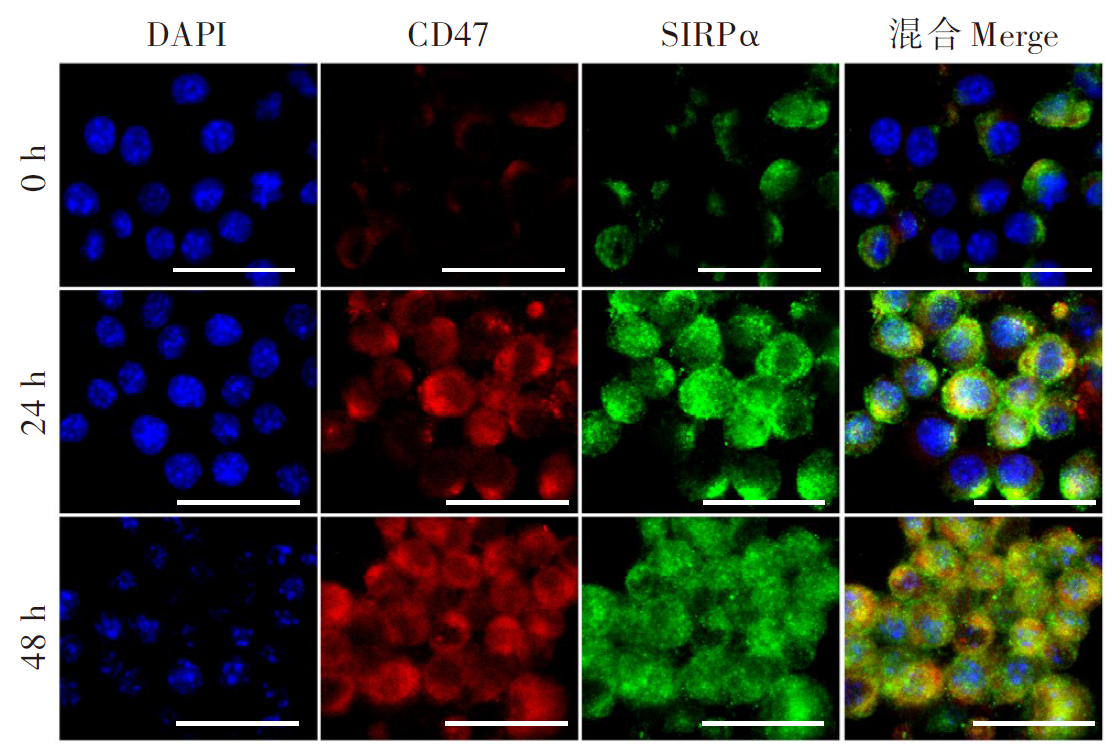
| [1] | Wen H, Vuitton L, Tuxun T, et al. Echinococcosis: Advances in the 21st century[J]. Clin Microbiol Rev, 2019, 32(2): e00075-18. | | [2] | 王旭, 王莹, 刘白雪, 等. 棘球绦虫和棘球蚴病的简明认知历史[J]. 中国寄生虫学与寄生虫病杂志, 2024, 42(3): 372-383. | | | Wang X, Wang Y, Liu BX, et al. A brief cognitive and historical overview of Echinococcus and echinococcosis[J]. Chin J Parasitol Parasit Dis, 2024, 42(3): 372-383. (in Chinese) | | [3] | Mao T, Chungda D, Phuntsok L, et al. Pulmonary echinococcosis in China[J]. J Thorac Dis, 2019, 11(7): 3146-3155. | | [4] | Strohaeker J, Sulyok M, Koenigsrainer A, et al. Alveolar echinococcosis: A challenging task for the hepatobiliary surgeon[J]. Pathogens, 2021, 11(1): 40. | | [5] | Wang H, Zhang CS, Fang BB, et al. Dual role of hepatic macrophages in the establishment of the Echinococcus multilocularis metacestode in mice[J]. Front Immunol, 2020, 11: 600635. | | [6] | Wang J, Gottstein B. Immunoregulation in larval Echinococcus multilocularis infection[J]. Parasite Immunol, 2016, 38(3): 182-192. | | [7] | Kisseleva T, Brenner D. Molecular and cellular mechanisms of liver fibrosis and its regression[J]. Nat Rev Gastroenterol Hepatol, 2021, 18(3): 151-166. | | [8] | Tsuchida T, Friedman SL. Mechanisms of hepatic stellate cell activation[J]. Nat Rev Gastroenterol Hepatol, 2017, 14(7): 397-411. | | [9] | Zhang T, Zhang YG, Yang ZH, et al. Echinococcus multilocularis protoscoleces enhance glycolysis to promote M2 Macrophages through PI3K/Akt/mTOR signaling pathway[J]. Pathog Glob Health, 2023, 117(4): 409-416. | | [10] | Zhang WQ, Zeng YH, Xiao QQ, et al. An in situ peptide-antibody self-assembly to block CD47 and CD24 signaling enhances macrophage-mediated phagocytosis and anti-tumor immune responses[J]. Nat Commun, 2024, 15(1): 5670. | | [11] | Biedermann A, Patra-Kneuer M, Mougiakakos D, et al. Blockade of the CD47/SIRPα checkpoint axis potentiates the macrophage-mediated antitumor efficacy of tafasitamab[J]. Haematologica, 2024, 109(12): 3928-3940. | | [12] | Zhang CS, Wang H, Aji T, et al. Targeting myeloid-derived suppressor cells promotes antiparasitic T-cell immunity and enhances the efficacy of PD-1 blockade (15 words)[J]. Nat Commun, 2024, 15(1): 6345. | | [13] | 沈银红, 张涛, 杨紫晗, 等. 多房棘球蚴对巨噬细胞糖代谢表型转变及极化类型影响的初步研究[J]. 中国血吸虫病防治杂志, 2023, 35(6): 590-603, 613. | | | Shen YH, Zhang T, Yang ZH, et al. Preliminary study on the effect of Echinococcus multilocaris on phenotypic transformations of glucose metabolism and polarization types in macrophages[J]. Chin J Schisto Control, 2023, 35(6): 590-603, 613. (in Chinese) | | [14] | Li JT, Zhao HY, Lv GD, et al. Phenotype and function of MAIT cells in patients with alveolar echinococcosis[J]. Front Immunol, 2024, 15: 1343567. | | [15] | Vuitton DA, Gottstein B. Echinococcus multilocularis and its intermediate host: A model of parasite-host interplay[J]. J Biomed Biotechnol, 2010, 2010: 923193. | | [16] | Heymann F, Tacke F. Immunology in the liver: From homeostasis to disease[J]. Nat Rev Gastroenterol Hepatol, 2016, 13(2): 88-110. | | [17] | 张伶慧, 陈根, 种世桂, 等. 多房棘球蚴病中免疫细胞调控机制的研究进展[J]. 中国寄生虫学与寄生虫病杂志, 2022, 40(1): 109-113, 120. | | | Zhang LH, Chen G, Chong SG, et al. Research progress on the immune regulation mechanism in alveolar echinococcosis[J]. Chin J Parasitol Parasit Dis, 2022, 40(1): 109-113, 120. (in Chinese) | | [18] | Yang HC, Shao RY, Huang HX, et al. Engineering macrophages to phagocytose cancer cells by blocking the CD47/SIRPɑ axis[J]. Cancer Med, 2019, 8(9): 4245-4253. | | [19] | Kharitonenkov A, Chen Z, Sures I, et al. A family of proteins that inhibit signalling through tyrosine kinase receptors[J]. Nature, 1997, 386(6621): 181-186. | | [20] | Huang CL, Wang XF, Wang YZ, et al. Sirpα on tumor-associated myeloid cells restrains antitumor immunity in colorectal cancer independent of its interaction with CD47[J]. Nat Cancer, 2024, 5(3): 500-516. | | [21] | Jalil AR, Andrechak JC, Discher DE. Macrophage checkpoint blockade: Results from initial clinical trials, binding analyses, and CD47-SIRPα structure-function[J]. Antib Ther, 2020, 3(2): 80-94. | | [22] | Hayes BH, Tsai RK, Dooling LJ, et al. Macrophages show higher levels of engulfment after disruption of cis interactions between CD47 and the checkpoint receptor SIRPα[J]. J Cell Sci, 2020, 133(5): jcs237800. | | [23] | Giatromanolaki A, Mitrakas A, Anestopoulos I, et al. Expression of CD47 and SIRPα macrophage immune-checkpoint pathway in non-small-cell lung cancer[J]. Cancers (Basel), 2022, 14(7): 1801. | | [24] | Morrissey MA, Kern N, Vale RD. CD47 ligation repositions the inhibitory receptor SIRPA to suppress integrin activation and phagocytosis[J]. Immunity, 2023, 56(9): 2172. | | [25] | Kim S, Kim YK, Kim S, et al. Dual-mode action of scalable, high-quality engineered stem cell-derived SIRPα-extracellular vesicles for treating acute liver failure[J]. Nat Commun, 2025, 16(1): 1903. | | [26] | Ma YY, Li JJ, Liu YM, et al. Identification and exploration of a new M2 macrophage marker MTLN in alveolar echinococcosis[J]. Int Immunopharmacol, 2024, 131: 111808. | | [27] | Gottstein B, Soboslay P, Ortona E, et al. Immunology of alveolar and cystic echinococcosis (AE and CE)[J]. Adv Parasitol, 2017, 96: 1-54. | | [28] | 鄂维建, 芦永良, 祁秉民, 等. 血清巨噬细胞极化相关因子与多房棘球蚴病肝纤维化的相关性分析[J]. 临床肝胆病杂志, 2021, 37(12): 2813-2818. | | | E WJ, Lu YL, Qi BM, et al. Association between serum macrophage polarization-related factors and liver fibrosis in echinococcosis multilocularis[J]. J Clin Hepatol, 2021, 37(12): 2813-2818. (in Chinese) | | [29] | Rao L, Wu L, Liu ZD, et al. Hybrid cellular membrane nanovesicles amplify macrophage immune responses against cancer recurrence and metastasis[J]. Nat Commun, 2020, 11(1): 4909. | | [30] | Zhang H, Huo Y, Zheng WJ, et al. Silencing of SIRPα enhances the antitumor efficacy of CAR-M in solid tumors[J]. Cell Mol Immunol, 2024, 21(11): 1335-1349. |
|

 ), 张耀刚2, 张涛3, 杨紫晗3, 侯静2, 田美媛2, 黄登亮2, 马艳艳4,*(