中国寄生虫学与寄生虫病杂志 ›› 2024, Vol. 42 ›› Issue (3): 316-324.doi: 10.12140/j.issn.1000-7423.2024.03.006

• 论著 • 上一篇    下一篇

绵羊肝细粒棘球蚴包囊形成不同时期的病理学变化观察

候梦丹1(), 吉古孝安1, 刘伟伟2, 邱美龄1, 胡美荷1, 李昆雷1, 加依娜尔·吉克散巴依1, 翟少华1,*()   

  1. 1 新疆农业大学动物医学学院,乌鲁木齐 830052
    2 和田地区中等职业技术学校,新疆和田 848000
  • 收稿日期:2023-11-24 修回日期:2024-01-14 出版日期:2024-06-30 发布日期:2024-07-16
  • 通讯作者: *翟少华(1981—),男,硕士,副教授,从事动物分子与免疫病理学研究。E-mail:122160075@qq.com
  • 作者简介:候梦丹(1996—),女,硕士研究生,从事动物分子与免疫病理学研究。E-mail:2522908934@qq.com
  • 基金资助:
    新疆维吾尔自治区自然科学基金重点项目(2023D01D04)

Pathological changes in the formation of Echinococcus granulosus cysts in sheep liver at different stages

HOU Mengdan1(), JIGU Xiaoan1, LIU Weiwei2, QIU Meiling1, HU Meihe1, LI Kunlei1, JIAYINAER Jikesanbayi1, ZHAI Shaohua1,*()   

  1. 1 College of Animal Medicine, Xinjiang Agricultural University, Urumqi 830052, China
    2 Secondary Vocational and Technical Schools in Hotan Prefecture, Hotan 848000, Xinjiang, China
  • Received:2023-11-24 Revised:2024-01-14 Online:2024-06-30 Published:2024-07-16
  • Supported by:
    Key Projects of Natural Science Foundation of Xinjiang Uygur Autonomous Region(2023D01D04)

摘要:

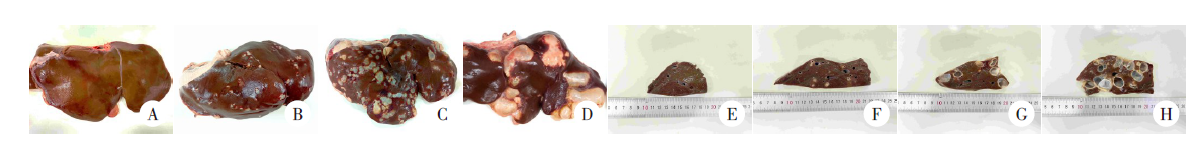
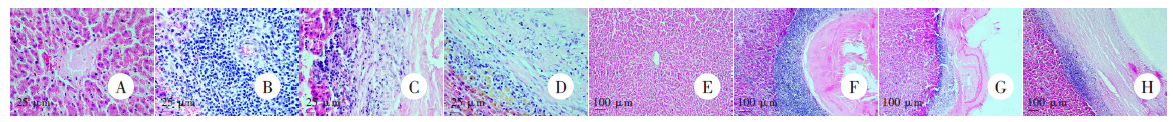
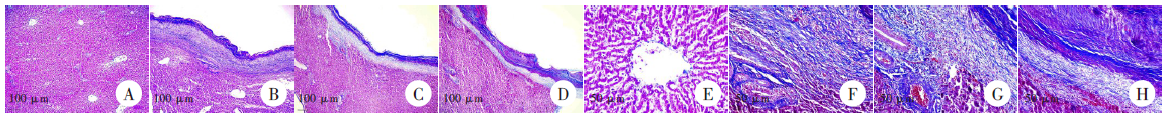
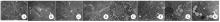
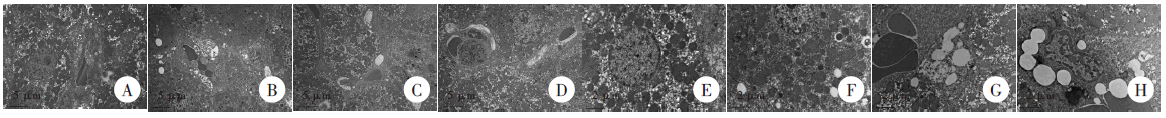
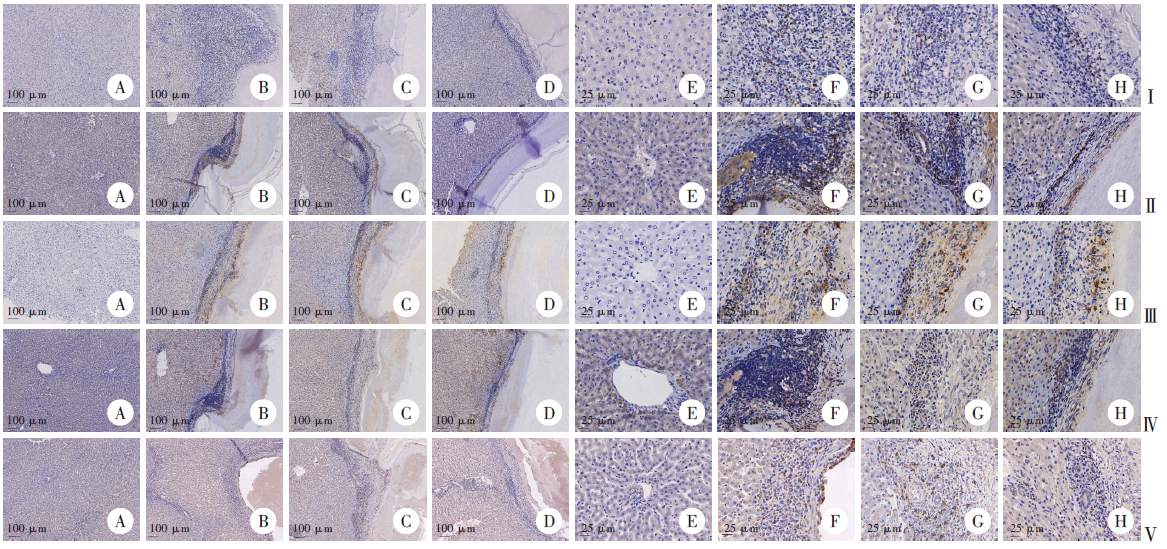
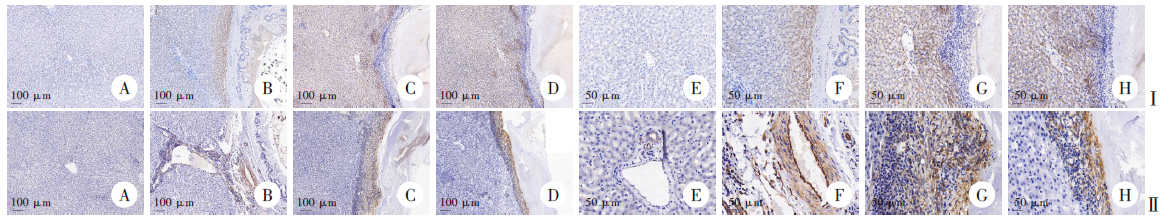
目的 观察绵羊细粒棘球蚴包囊形成不同时期的肝细胞损伤、局部炎症反应,以及包囊纤维蛋白组成的病理学特征。 方法 收集新疆乌鲁木齐市某屠宰场阿勒泰羊中有明显细粒棘球蚴包囊的肝脏,根据包囊的形态特征分为包囊发育期组、包囊形成期组和包囊成熟期组,取各组包囊与健康肝组织交界处的病变组织制备切片,以健康羊肝组织为对照组。苏木素-伊红(HE)染色观察包囊周围肝细胞形态特征及周围组织形态学变化,Masson染色观察包囊形成不同时期囊壁的纤维化过程,透射电子显微镜观察肝细胞超微结构变化,免疫组织化学染色观察不同时期包囊及其周围组织的炎症细胞CD3+ T淋巴细胞(CD3+)、CD25+调节性T细胞(CD25+)、CD56+自然杀伤细胞(CD56+)、CD14+单核巨噬细胞(CD14+)、嗜碱粒细胞CD63(CD63),以及纤维化蛋白Ⅰ型胶原蛋白1(COL1)、COL3、α-平滑肌动蛋白(α-SMA)、钙结合蛋白A4(S100A4)、基质金属蛋白酶2(MMP2)和细胞因子肿瘤坏死因子-α(TNF-α)、血管内皮生长因子受体-3(VEGFR-3)的表达变化。组间比较采用单因素ANOVA分析,两两比较采用LSD-t检验。 结果 HE染色结果可见,包囊发育期,囊壁有明显的炎症反应带及炎症细胞团的形成,炎症细胞向囊外周肝实质扩散;包囊形成期,囊壁变薄,炎症细胞数量明显减少,炎症反应带变薄;包囊成熟期,囊壁纤维组织增生形成包囊的外壁角质层,炎症细胞数量减少。Masson染色结果可见,包囊发育期的囊壁外周有大量纤维组织产生,并向周围肝组织内延伸;包囊形成期包囊生长发育,炎症反应减弱,囊壁纤维组织发育成熟;包囊成熟期形成致密的纤维性囊壁。透射电子显微镜观察可见,随着包囊发育形成,肝细胞线粒体逐渐肿大、数量增多,肝细胞中的脂滴数量增多、体积增大。免疫组织化学染色结果显示,随着包囊的增大,囊壁炎症反应带变薄,炎症细胞阳性表达范围减小,表达量减少;包囊形成期、包囊发育期、包囊成熟期的炎症细胞平均光密度值,CD3+分别为0.171 ± 0.009、0.132 ± 0.009、0.120 ± 0.006(F = 1.640,P > 0.05),CD25+分别为0.302 ± 0.012、0.174 ± 0.009、0.080 ± 0.005(F = 49.051,P < 0.01),CD56+分别为0.219 ± 0.008、0.209 ± 0.009、0.118 ± 0.004(F = 126.411,P < 0.01),CD14+分别为0.140 ± 0.027、0.096 ± 0.012、0.090 ± 0.017(F = 3.954,P > 0.05),CD63分别为0.318 ± 0.007、0.096 ± 0.013、0.086 ± 0.011(F = 307.442,P < 0.01);纤维化蛋白阳性表达范围增大,表达量增多,平均光密度值COL1分别为0.139 ± 0.029、0.157 ± 0.022、0.186 ± 0.014(F = 2.136,P > 0.05),COL3分别为0.109 ± 0.014、0.144 ± 0.008、0.206 ± 0.008(F = 42.116,P < 0.01),α-SMA分别为0.255 ± 0.008、0.283 ± 0.009、0.301 ± 0.022(F = 5.106,P < 0.05),S100A4分别为0.210 ± 0.012、0.248 ± 0.004、0.258 ± 0.007(F = 18.137 3,P < 0.01),MMP2分别为0.155 ± 0.002、0.172 ± 0.011、0.185 ± 0.008(F = 7.853,P < 0.05);TNF-α在包囊周围组织表达,阳性表达范围增大,表达量增多,平均光密度分别为0.115 ± 0.016、0.263 ± 0.003、0.267 ± 0.006(F = 145.627,P < 0.01);VEGFR-3在包囊壁表达,包囊形成期表达最多,3个包囊期分别为0.248 ± 0.009、0.357 ± 0.045、0.268 ± 0.004(F = 9.423,P < 0.05);3个包囊期各指标的平均光密度值均高于健康肝脏(均P < 0.01)。 结论 随着包囊发育,包囊及周围肝组织具有不同程度的肝细胞损伤、囊壁结构变化和纤维化反应,肝脏线粒体代谢加强,影响脂肪代谢。

关键词: 细粒棘球蚴, 包囊, 病理学, 炎性细胞, 纤维化, 绵羊

Abstract:

Objective To observe the pathological characteristics of hepatocyte damage, local inflammation response, and the composition of cyst fibrin in liver of Echinococcus granulosus infected sheep during the cyst formation at different stages. Methods Livers with significant E. granulosus cysts were collected from slaughtered Altai sheep in an abattoir in Urumqi City, Xinjiang, China. From the sampled livers, cysts were separated and assigned into the groups of development stage, formation stage and mature stage according to the morphological features of the cysts. The cysts of all groups and the lesion tissues at the junction with healthy liver tissues were used to prepare paraffin sections. Liver tissues from healthy sheep were used as the control. The morphological features and changes of the hepatocytes and liver tissues around the cysts were observed by hematoxylin-eosin (HE) staining, and the fibrosis process of the cyst wall at different formation stages was observed by Masson staining. Transmission electron microscope was used to observe the ultrastructural changes of hepatocytes. Immunohistochemical staining was used to observe the cysts and surrounding tissues at different cyst-formation stages for the changes of inflammatory cells CD3+ T lymphocytes (CD3+), CD25+ regulatory T cells (CD25+), CD56+ NK cells (CD56+), CD14+ monocyte macrophages (CD14+) and basophilic granulocytes CD63 (CD63), as well as the changes of expression of fibrotic proteins collagen type I (COL1), COL3, alpha-smooth muscle actin (a-SMA), calcium-binding protein A4 (S100A4), matrix metalloproteinase 2 (MMP2) and tumour necrosis factor-alpha (TNF-α), and vascular endothelial growth factor receptor-3 (VEGFR-3). One-way ANOVA analysis was used for comparison between groups, and the LSD-t test was used for pairwise comparison. Results The HE staining results showed that the liver exhibited significant inflammatory reaction bands and inflammatory cell clusters in the cyst wall during the encapsulation development stage. The inflammatory cells spread to the liver parenchyma in the periphery of the cyst, and the hepatocytes around the encapsulation atrophied, degenerated, and damaged. During the formation of the encapsulation, the cyst wall became thinner, the number of inflammatory cells decreased, the inflammatory reaction bands became thinner, the encapsulation cavity enlarged. In the maturation stage, fibrous tissue proliferation occurred in the encapsulation wall to form the cuticle, and the number of inflammatory cells decreased. The outer wall of the cyst, known as the stratum corneum, was formed by the proliferation of fibrous tissue. The number of inflammatory cells decreased, resulting in a significant reduction in the inflammatory response. Masson’s staining showed that a large amount of fibrous tissue was produced in the periphery of the cyst wall during the period of cyst development and showed extensive growth into the surrounding liver tissue. The cyst grew and developed during the period of cyst formation, the inflammatory response was attenuated, the fibrous tissue of the cyst wall matured, and a dense, fibrous cyst wall was formed during the period of cyst maturation. Transmission electron microscopy showed that as the cyst developed and formed, the mitochondria of the hepatocytes gradually enlarged and increased in number, and the lipid droplets in the hepatocytes increased in number and size. Immunohistochemical staining showed that as the cyst increases, the inflammatory response zone on the cyst wall becomes thinner, the range of positive expression of inflammatory cells decreases, and the expression level decreases. The mean optical density of the CD3+ inflammatory cells at the cyst developmental stage, cyst formation stage, and cyst maturation stage were 0.171 ± 0.009, 0.132 ± 0.009, 0.120 ± 0.006 (F = 1.640, P > 0.05); CD25+ cells were 0.302 ± 0.012, 0.174 ± 0.009, and 0.080 ± 0.005 (F = 49.051, P < 0.01); CD56+ cells were 0.219 ± 0.008, 0.209 ± 0.009, and 0.118 ± 0.004 (F = 126.411, P < 0.01), CD14+ cells were 0.140 ± 0.027, 0.096 ± 0.012, 0.090 ± 0.017 (F = 3.954, P > 0.05); CD63 cells were 0.318 ± 0.007, 0.096 ± 0.013, 0.086 ± 0.011 (F = 307.442, P < 0.01). The positive expression range and expression level of fibroin increased, and the mean optical density of COL1 were 0.139 ± 0.029, 0.157 ± 0.022, 0.186 ± 0.014 (F = 2.136, P > 0.05); COL3 were 0.109 ± 0.014, 0.144 ± 0.008, 0.206 ± 0.008 (F = 42.116, P < 0.01); α-SMA were 0.255 ± 0.008, 0.283 ± 0.009, 0.301 ± 0.022 (F = 5.106, P < 0.05); MMP2 were 0.155 ± 0.002, 0.172 ± 0.011, 0.185 ± 0.008 (F = 7.853, P < 0.05); S100A4 were 0.210 ± 0.012, 0.248 ± 0.004, 0.258 ± 0.007 (F = 18.137 3, P < 0.05). TNF-α was expressed in the surrounding tissue of the cyst, the positive expression range increased, and the expression level increased. the mean optical density of TNF-α were 0.115 ± 0.016, 0.263 ± 0.003, 0.267 ± 0.006 (F = 145.627, P < 0.01). VEGFR-3 VEGFR-3 was expressed in the cyst wall, with the highest expression during the formation of the cyst, and the mean optical density at 3 stages were 0.248 ± 0.009, 0.357 ± 0.045, 0.268 ± 0.004 (F = 9.423, P < 0.05). The mean optical density values in the cyst phase were higher than those in healthy livers (all P < 0.01). Conclusion As the cyst develops, the cyst and its surrounding liver tissue show varying degrees of hepatocellular damage, cyst wall structural changes and fibrotic response, enhanced liver mitochondrial metabolism, lipid metabolism affected, as well as the cyst-surrounding inflammatory cytokines and liver fiber seen in the inflammatory zone of cyst wall.

Key words: Echinococcus granulosus, Cyst, Pathology, Inflammatory cell, Fibrosis, Sheep

中图分类号: