中国寄生虫学与寄生虫病杂志 ›› 2019, Vol. 37 ›› Issue (2): 213-218.doi: 10.12140/j.issn.1000-7423.2019.02.017

• 论著 • 上一篇    下一篇

Cu2+胁迫下福寿螺谷胱甘肽S转移酶基因表达分析

茅光耀(), 周鸿让, 黄芸, 岳志远, 段磊, 许秋利, 郭云海, 党志胜, 张仪, 肖宁*()   

  1. 中国疾病预防控制中心寄生虫病预防控制所,国家热带病研究中心,世界卫生组织热带病合作中心,科技部国家级热带病国际联合研究中心,卫生部寄生虫病原与媒介生物学重点实验室,上海 200025
  • 收稿日期:2019-01-28 出版日期:2019-04-30 发布日期:2019-05-13
  • 通讯作者: 肖宁
  • 作者简介:

    作者简介:茅光耀(1993-),男,硕士研究生,从事寄生虫病媒介生物研究。E-mail:maoguangyao1993@126.com

  • 基金资助:
    国家重点研发计划(No. 2016YFC1200500)

Analysis of glutathione S-transferase gene expression in Pomacea canaliculata under Cu2+ stress

Guang-yao MAO(), Hong-rang ZHOU, Yun HUANG, Zhi-yuan YUE, Lei DUAN, Qiu-li XU, Yun-hai GUO, Zhi-sheng DANG, Yi ZHANG, Ning XIAO*()   

  1. National Institute of Parasitic Diseases, Chinese Center for Disease Control and Prevention;Chinese Center for Tropical Diseases Research;WHO Collaborating Centre for Tropical Diseases;National Center for International Research on Tropical Diseases, Ministry of Science and Technology;Key Laboratory of Parasite and Vector Biology, Ministry of Health, Shanghai 200025, China
  • Received:2019-01-28 Online:2019-04-30 Published:2019-05-13
  • Contact: Ning XIAO
  • Supported by:
    Supported by the National Key Research and Development Program of China (No. 2016YFC1200500)

摘要:

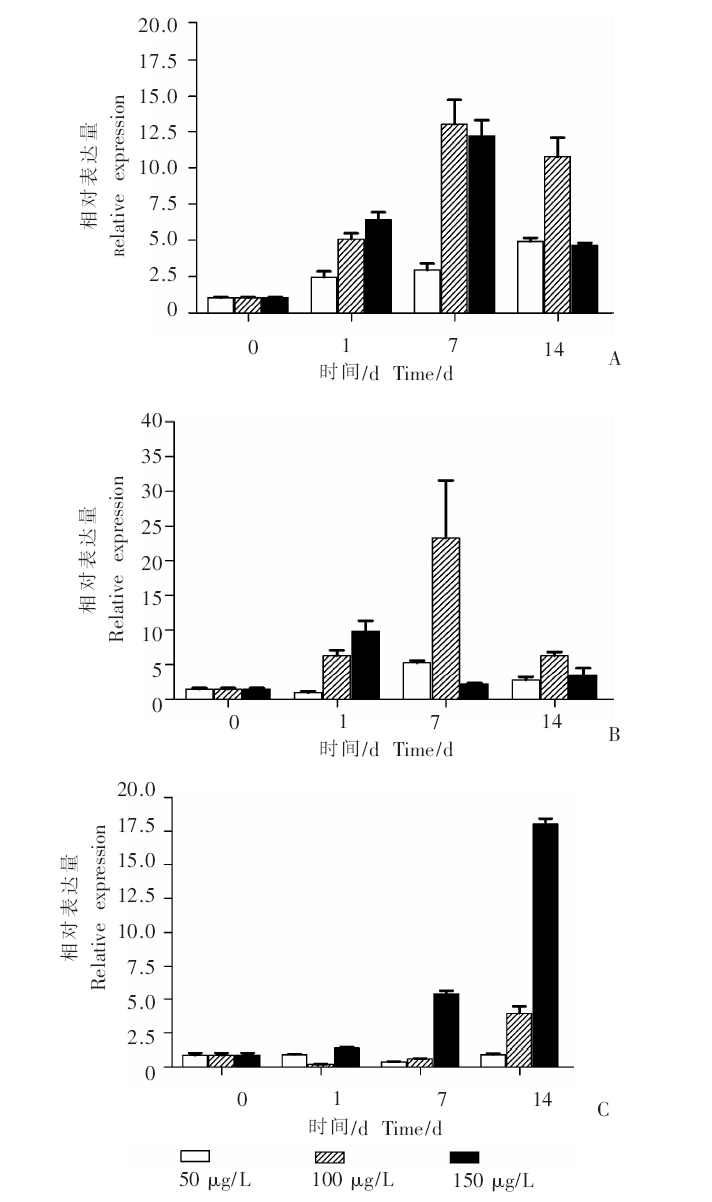
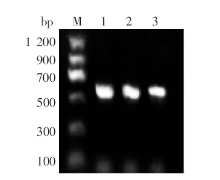
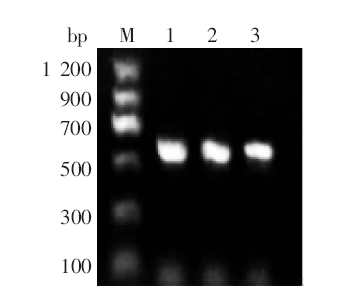
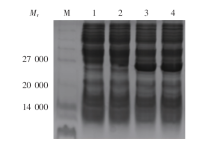
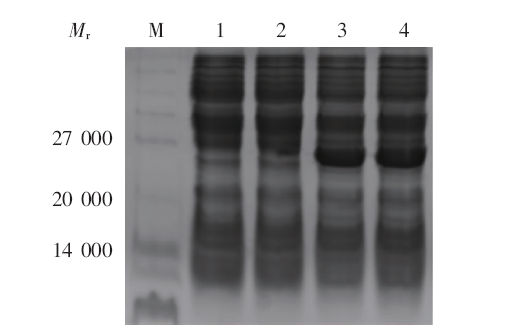
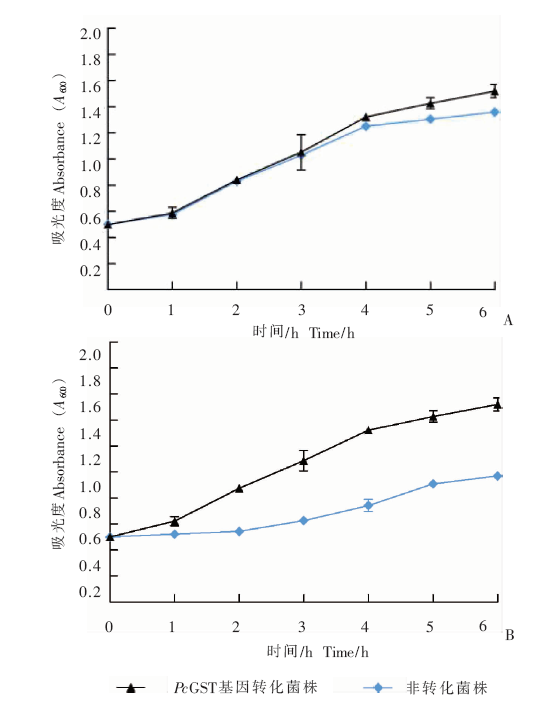
目的 分析Cu2+胁迫前后福寿螺谷胱甘肽S转移酶(PcGST)基因的表达规律,探讨福寿螺适应Cu2+的相关机制。 方法 80只福寿螺随机分为4组,每组20只福寿螺,Cu2+胁迫浓度分别为0、50、100、150 μg/L。分别于Cu2+胁迫后的0、1、7、14 d,各组随机取3只福寿螺,分离其肝脏、鳃、肾脏组织,分别提取组织中的RNA,逆转录为cDNA,实时荧光定量PCR检测Cu2+胁迫前后PcGST mRNA的相对表达量。基于Cu2+胁迫下的福寿螺基因转录组筛选获得PcGST基因,构建pET-28a-PcGST重组质粒,转化至大肠埃希菌(E. coil)BL21(DE3)感受态细胞中,经异丙基-β-D-硫代半乳糖苷(IPTG)诱导表达,十二烷基磺酸钠-聚丙烯酰胺凝胶电泳(SDS-PAGE)分析重组蛋白表达情况。将转化菌株(含PcGST基因的E. coil)和非转化菌株(未转化的E. coil)等量分成6份,随机取3份作为Cu2+胁迫组(含0.2 mmol/L的CuSO4),另3份作为对照组(不含CuSO4),20 ℃、150 r/min 摇床培养。每隔1 h测定一次菌液吸光度(A600)值,连续测定6 h。采用t检验比较转化菌株和非转化菌株对Cu2+的耐受能力。 结果 设定无Cu2+胁迫下的福寿螺组织中PcGST mRNA的相对表达量为1.0 ± 0.0。肝脏组织中,50 μg/L Cu2+胁迫下,PcGST mRNA的相对表达量于0~14 d呈持续上升趋势,峰值为4.9 ± 0.5;100 μg/L、150 μg/L Cu2+胁迫下,PcGST mRNA的相对表达量先上升后下降,峰值均于7 d出现,分别为13.0 ± 3.0和12.2 ± 2.2。鳃组织中,50 μg/L、100 μg/L Cu2+胁迫下,PcGST mRNA的相对表达量先上升后下降,峰值均于7 d出现,分别为5.3 ± 0.7和23.3 ± 16.5;150 μg/L Cu2+胁迫下,PcGST mRNA的相对表达量也呈现先上升后下降的趋势,峰值于1 d出现,为9.8 ± 3.3。肾脏组织中,50 μg/L Cu2+胁迫下,PcGST mRNA的相对表达量随时间变化不显著;100 μg/L Cu2+胁迫下,PcGST mRNA的相对表达量前期随时间变化不显著,于14 d出现显著增加,为3.9 ± 1.0;150 μg/L Cu2+胁迫下,PcGST mRNA的相对表达量于0~14 d呈持续上升趋势,峰值为18.0 ± 0.8。PcGST基因PCR扩增产物约为600 bp。SDS-PAGE结果显示,PcGST蛋白的相对分子质量(Mr)约为26 370。LB液体培养基中,转化菌株与非转化菌株的生长曲线接近,最大A600值分别为1.5 ± 0.0和1.4 ± 0.0,差异无统计学意义(P > 0.05);含0.2 mmol/L CuSO4的LB液体培养基中,转化菌株的生长曲线优于非转化菌株,最大A600值分别为1.5 ± 0.1和1.0 ± 0.0,差异有统计学意义(P < 0.05)。 结论 Cu2+胁迫能促进福寿螺体内PcGST基因的表达。

关键词: 福寿螺, Cu2+胁迫, 谷胱甘肽S转移酶, 基因表达分析

Abstract:

Objective The expression of glutathione S-transferase gene in Pomacea canaliculata (PcGST) was analyzed under Cu2+ stress which is toxic to snail, and the related mechanism of P. canaliculata adaptation to Cu2+ stress was discussed. Methods Eighty snails were randomly divided into four groups. Four Cu2+ stress concentrations (0, 50, 100, 150 μg/L) were set to each group of 20 snails. Three snails from each group were randomly selected on 0, 1, 7, and 14 d after Cu2+ stress, and the liver, gill and kidney tissues were isolated. Total RNA were extracted from these tissues of P. canaliculata and reverse transcribed into cDNA. Real-time quantitative PCR was used to detect the relative expression of PcGST mRNA under Cu2+ stress. The PcGST gene was amplified from P. canaliculata tissue and then cloned into pET-28a expression plasmid. The recombinant plasmid pET-28a-PcGST was transformed into Escherichia coli BL21(DE3) bacteria and the recombinant PcGST was expressed under induction of isopropyl-β-D-thiogalactoside(IPTG). The expressed recombinant PcGST was analyzed by SDS-PAGE. The PcGST transformed E. coli BL21 and untransformed plain BL21 were equally divided into 6 aliquots. Three aliquots were randomly selected as Cu2+ stress group (with 0.2 mmol/L CuSO4) and the other three as control group (without CuSO4). All bacterial aliquots were cultured in a shaking incubator at 20 ℃ 150 r/min. A600 of bacterial culture was measured every 1 hour until 6 hours. The tolerance of PcGST transformed and non-transformed bacteria to Cu2+ stress was compared by t-test. Results The relative expression of PcGST mRNA in P. canaliculata tissue without Cu2+ stress was set as 1.0 ± 0.0. In the liver tissue, under the stress of 50 μg/L Cu2+, the relative expression of PcGST mRNA increased continuously from 0 to 14 days, with a peak value of 4.9 ± 0.5, the relative expression of PcGST mRNA have gone up and then down, with a peak value of 13.0 ± 3.0 and 12.2 ± 2.2 on 7 d under 100 μg/L and 150 μg/L Cu2+ stress, respectively. In the gill tissue, the relative expression of PcGST mRNA have gone up and then down, with a peak value of 5.3 ± 0.7 and 23.3 ± 16.5 on 7 d under 50 μg/L and 100 μg/L Cu2+ stress, respectively, the relative expression of PcGST mRNA reached the peak of 9.8 ± 3.3 on 1 d then decreased under 150 μg/L Cu2+ stress. In the kidney tissue, the relative expression of PcGST mRNA did not increase at the early incubation under the stress of 50 and 100 μg/L Cu2+ till 7 d and reached the peak of 3.9 ± 1.0 under the stress of 100 μg/L Cu2+, the relative expression of PcGST mRNA reached the peak of 18.0 ± 0.8 on 14 d under the stress of 150 μg/L Cu2+. The The PcGST DNA was successfully amplified from P. canaliculate tissue with a size of approximate 600 bp and cloned into expression vector pET-28a. After being expressed in E. coli BL21, the expressed recombinant PcGST was appeared as 26 370 on SDS-PAGE. The PcGST transformed E. coli BL21 were grown better than the E. coli BL21 without PcGST transformed in LB liquid medium containing 0.2 mmol/L, with A600 of 1.5 ± 0.1 and 1.0 ± 0.0, respectively, after 6 h culture, with statistical difference (P < 0.05), while the PcGST transformed and untransformed bacteria grew at the similar rate in LB liquid medium without Cu2+.Conclusion PcGST gene was upregulated in P. canaliculate tissue under Cu2+ stresss.

Key words: Pomacea canaliculata, Cu2+ stress, Glutathione S-transferase, Analysis of gene expression

中图分类号: